- Published on
Graphical Identification
A causal graph turns assumptions about direction and common causes into a visible structure. The main question is not which model predicts best. It is whether the effect of an intervention can be recovered from the available observations under the proposed graph.
Backdoor adjustment
Let be an action or exposure, the outcome, and a set of observed common causes. For a discrete , the adjustment formula is
The expression on the left is the average outcome if were set to . The inner expectation is the observed average outcome among cases with and . The probability weights that average by how often each value of occurs. The formula is valid only when the stated graph makes a sufficient adjustment set.
The arrow from to represents the effect of interest. The path through creates a second association, so must be included in the adjustment under this graph.
Frontdoor identification
Sometimes no observed set blocks the backdoor paths from to , but an observed mediator can still identify the effect. For discrete variables, the frontdoor formula is
Here, lies on the causal route from to , indexes its possible values, and indexes the observed values of used in the second adjustment. This formula needs stronger structural conditions than the equation alone can show. In particular, the graph must support identification of both the effect of on and the effect of on .
What the graph permits
| Structure | Question answered | Main condition to examine |
|---|---|---|
| Backdoor adjustment | Which observed variables should be adjusted for? | All noncausal paths from to are blocked |
| Frontdoor identification | Can a mediator recover the effect? | The required paths into and out of the mediator satisfy the frontdoor conditions |
| Instrumental variable | Can outside variation isolate part of the effect? | The instrument changes but has no separate route to |
A graph can make assumptions precise and reveal contradictions. It cannot prove that its own arrows are correct from observational data alone. Subject knowledge and study design remain essential.
Comparing routes to causal identification
The backdoor experiment repeats the analysis while increasing the influence of a common cause. The known effect is fixed, so the error of each estimate can be measured directly.
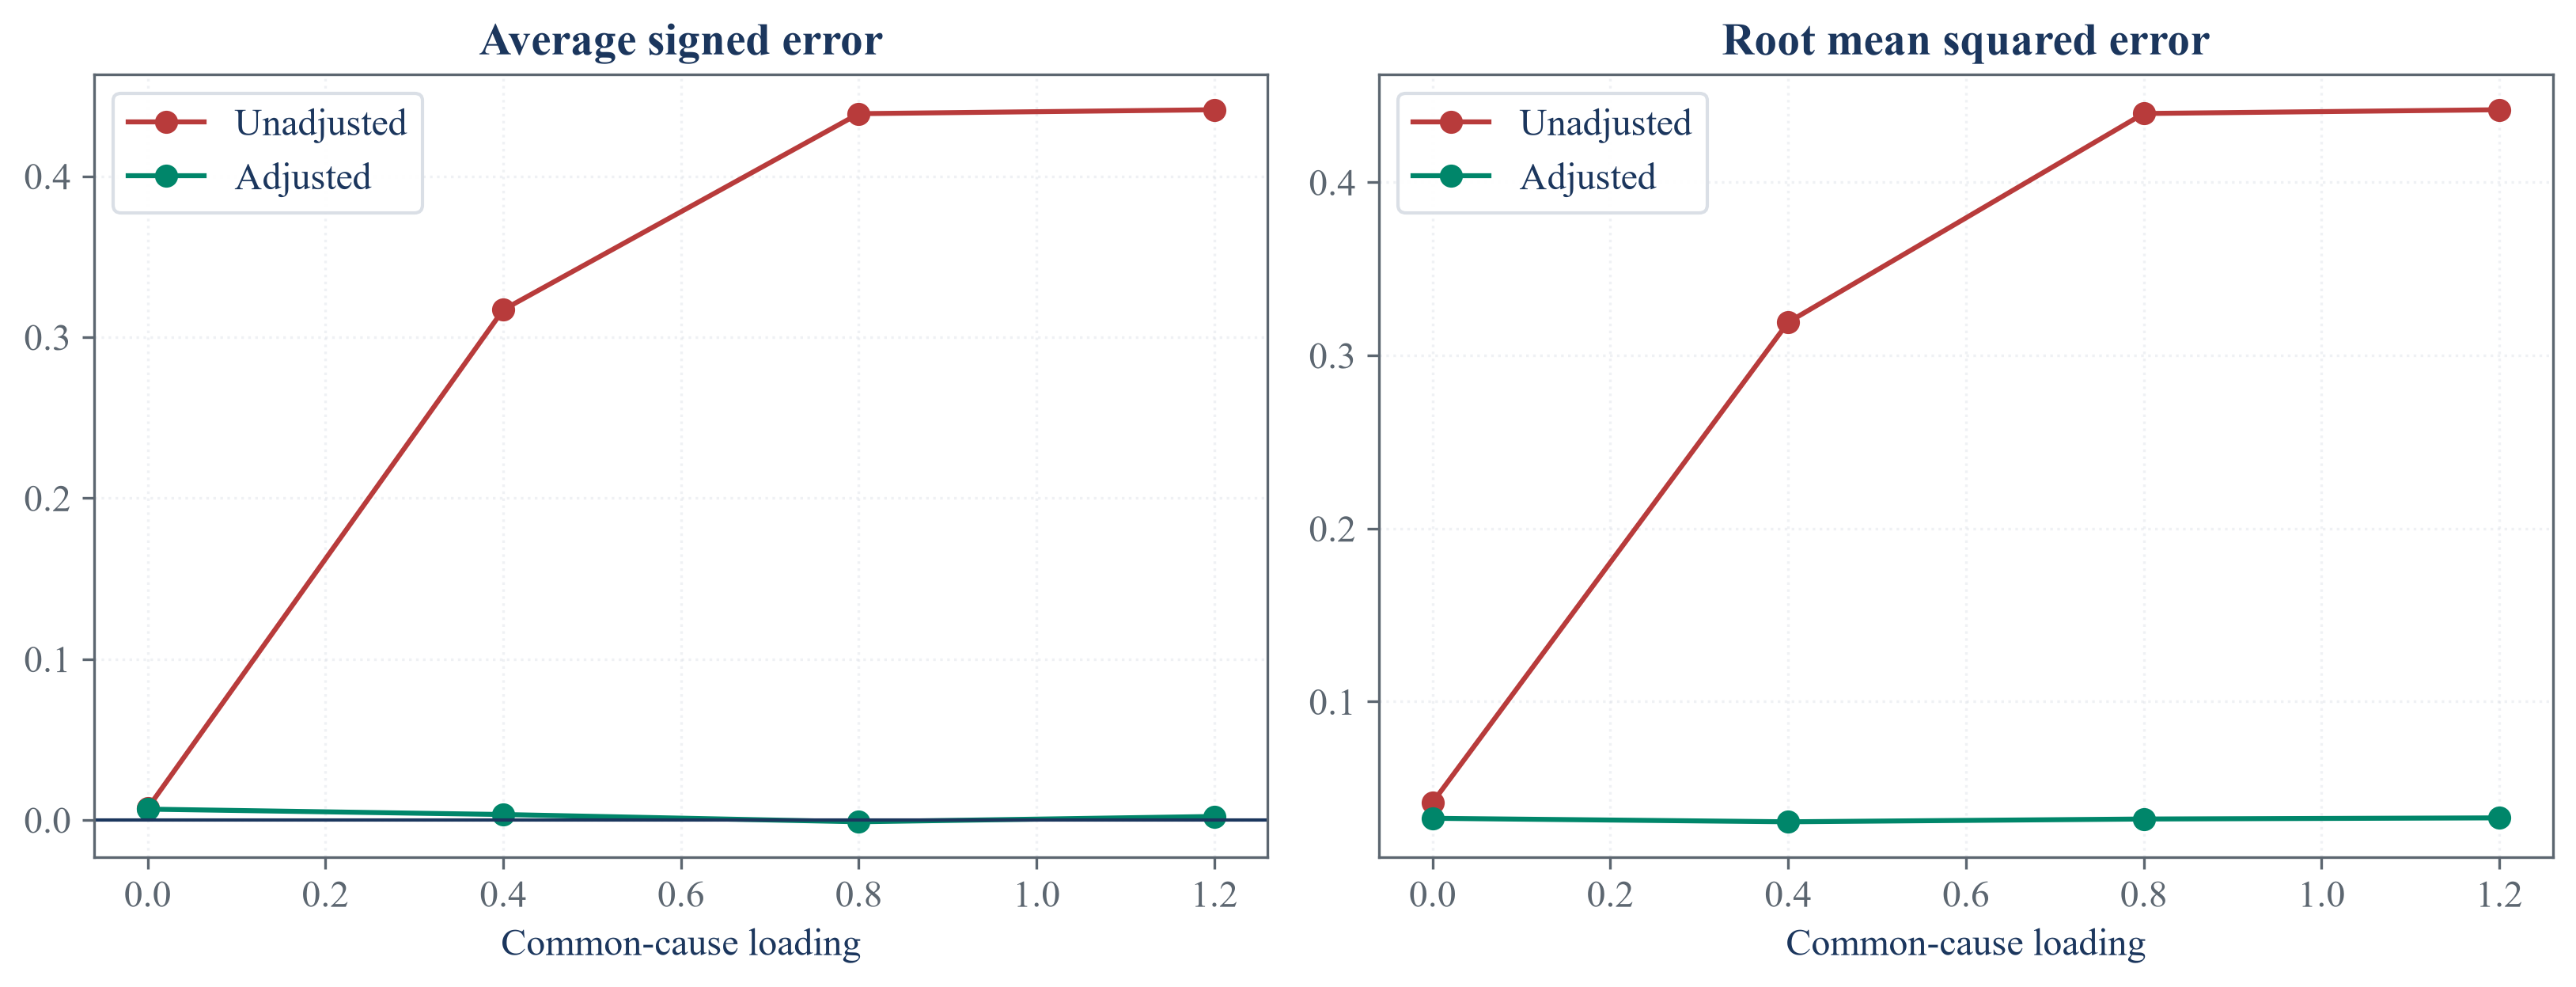
The unadjusted estimate develops substantial error as the common cause becomes stronger. The adjusted estimate stays near the known effect in these generated samples.
The frontdoor experiment compares the full distribution of estimates over 200 generated samples.
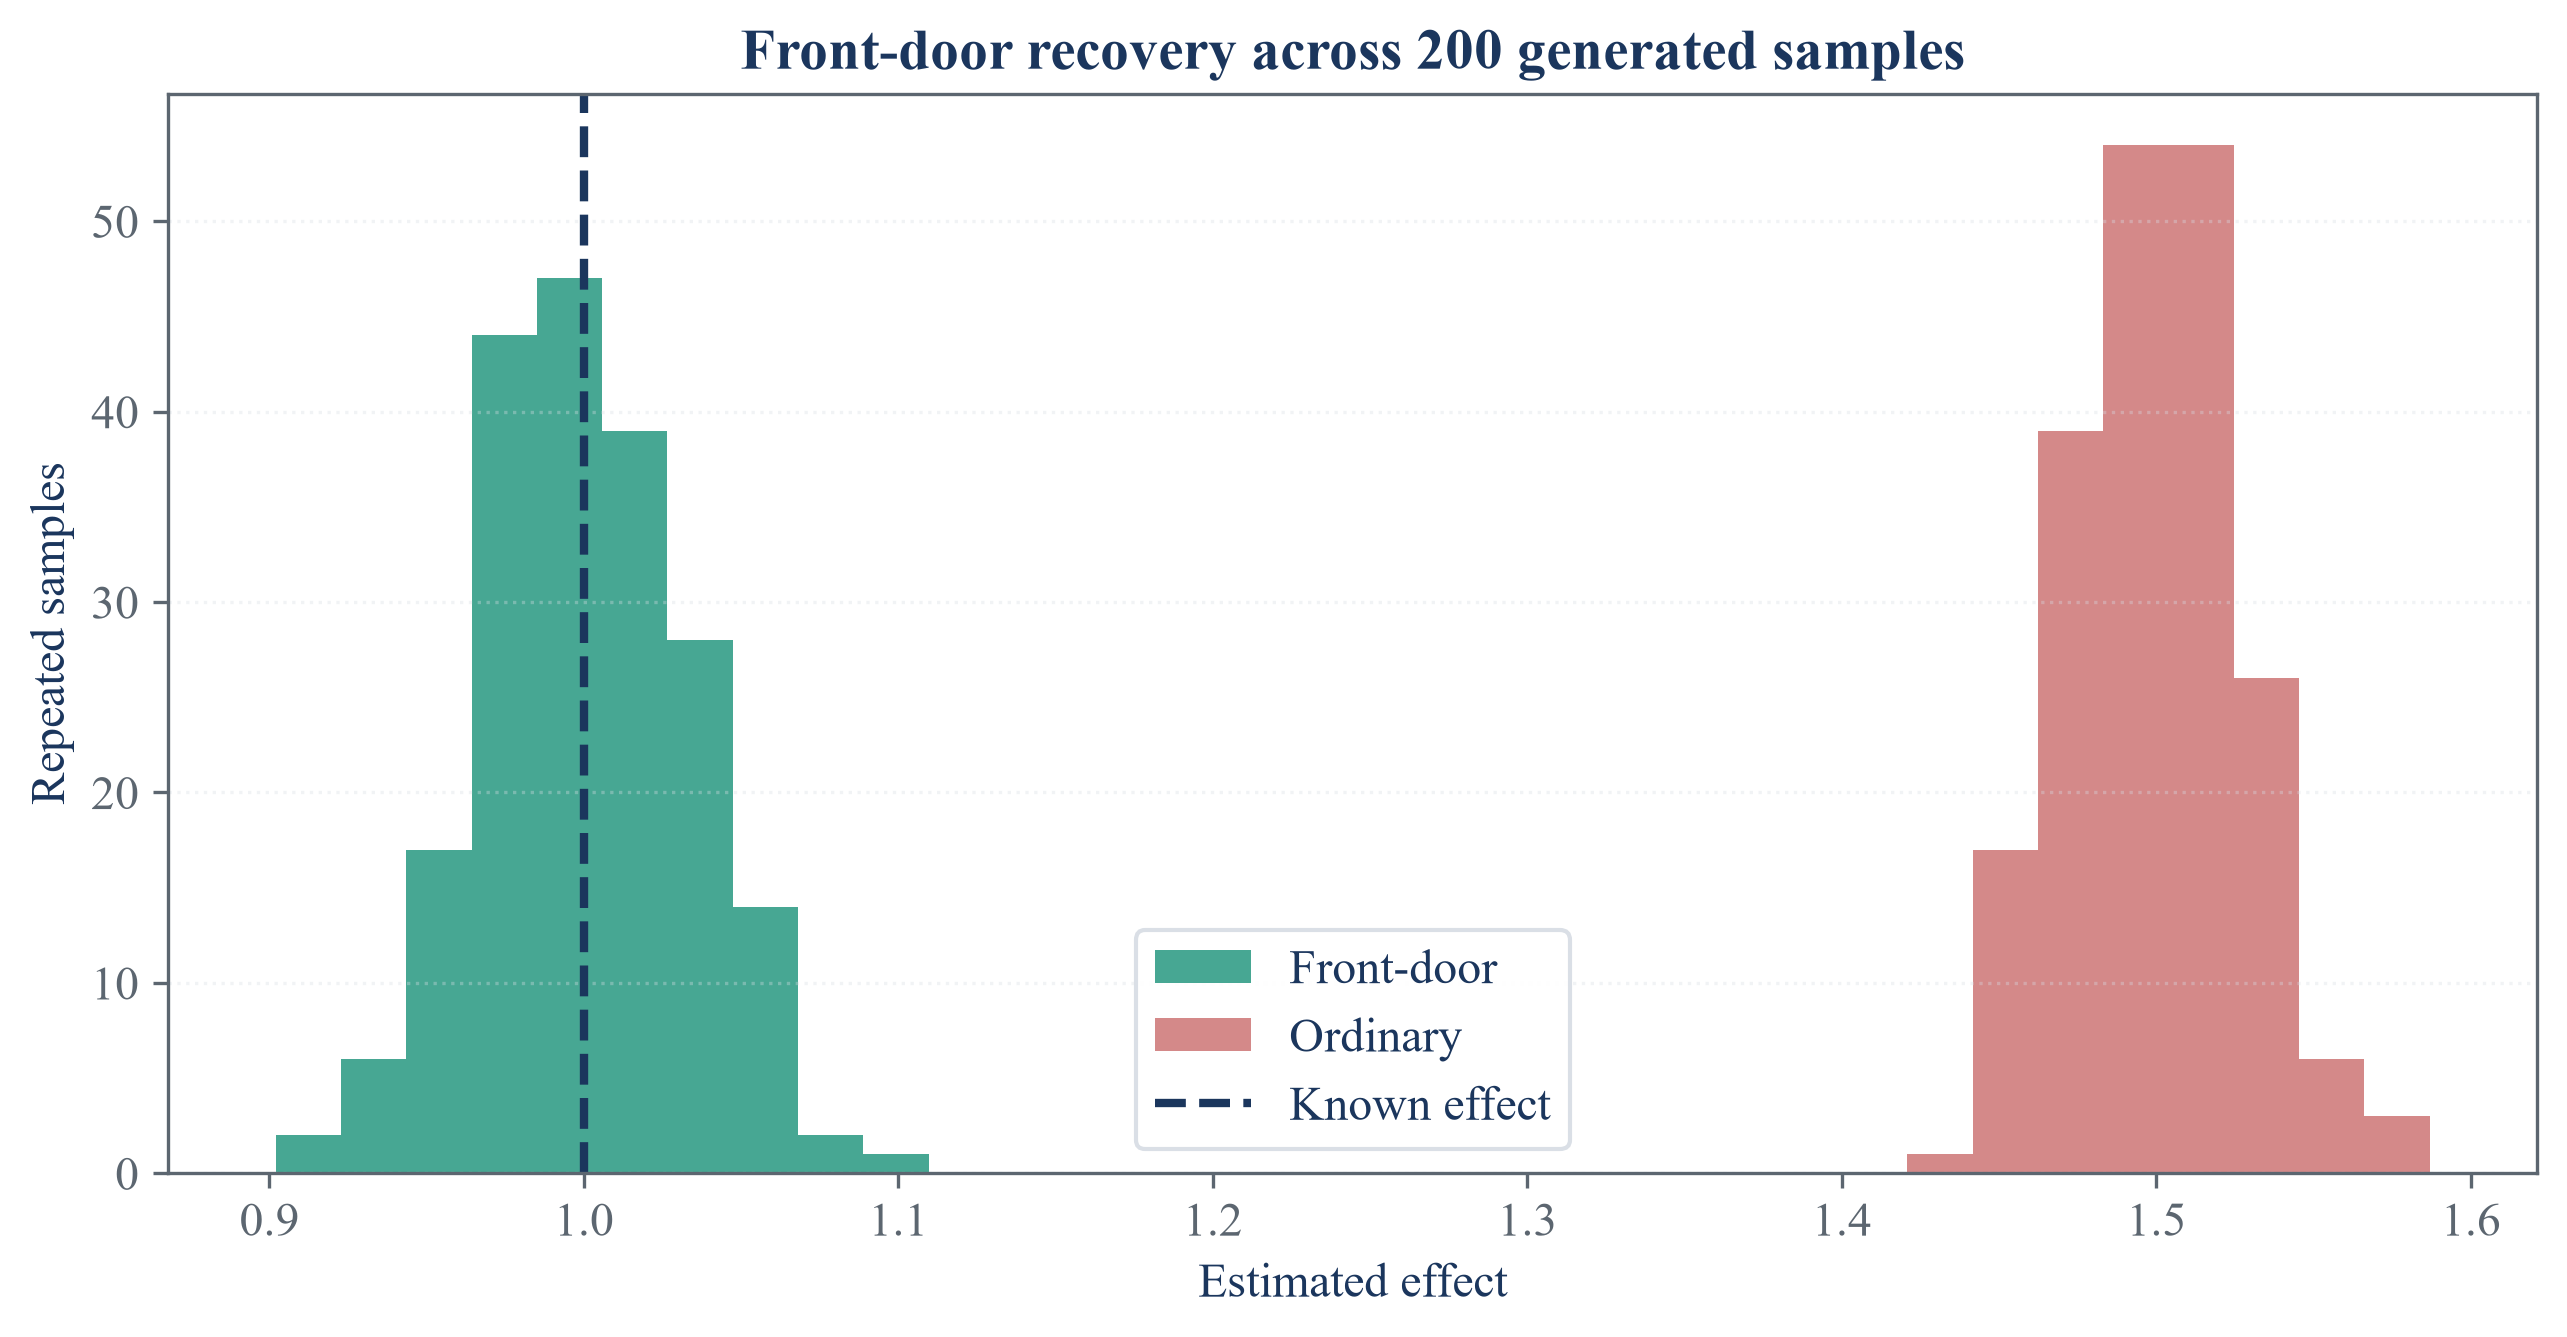
The frontdoor estimates gather around the known effect. Ordinary regression remains displaced because the treatment and outcome share an unmeasured common cause in this experiment.
The instrumental-variable experiment then changes the strength of the first-stage relationship.
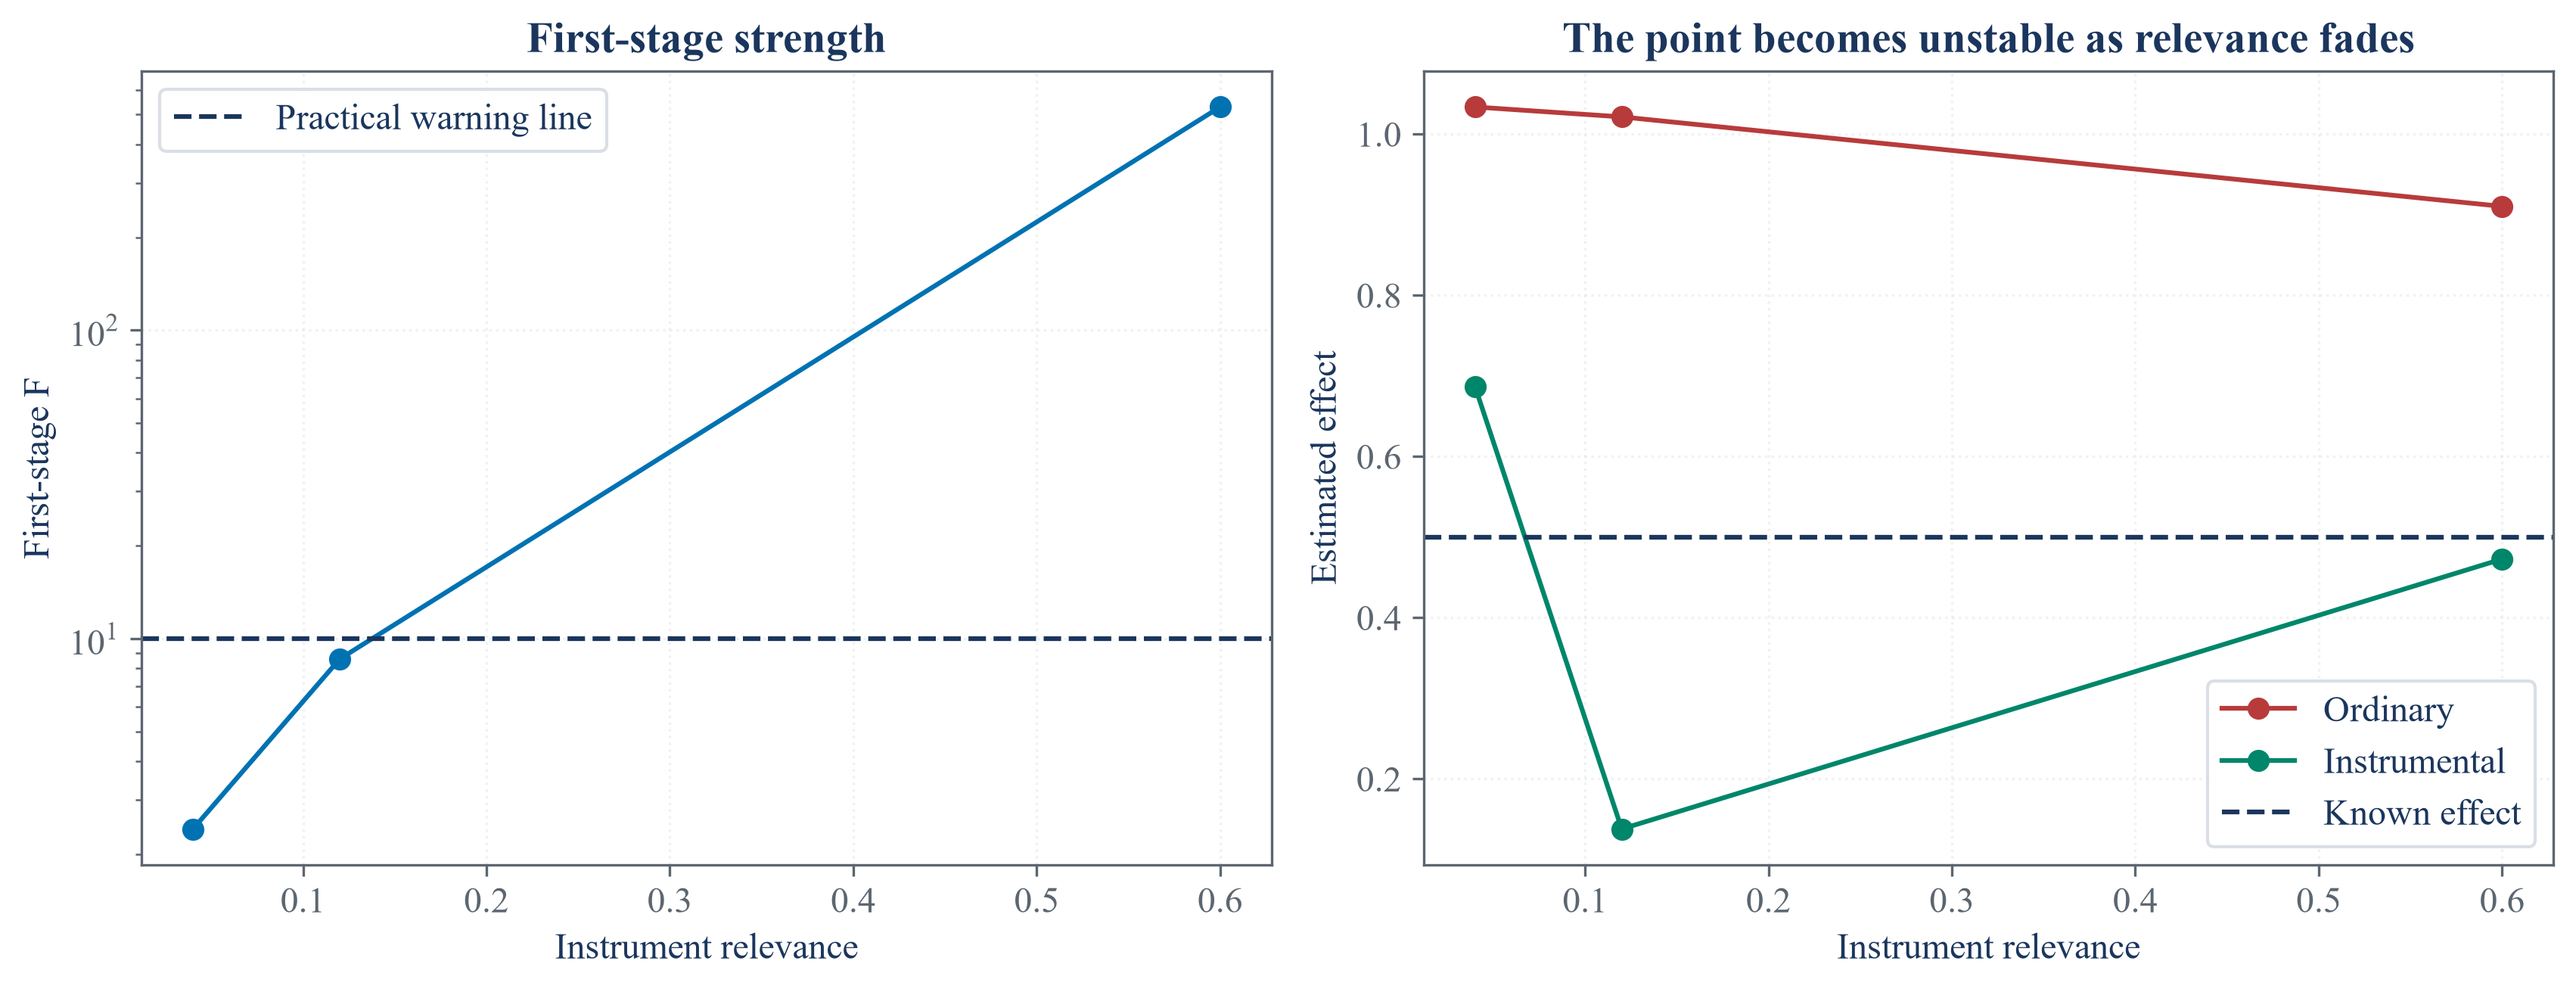
As instrument relevance weakens, the first-stage statistic falls and the instrumental estimate becomes unstable. The warning line at 10 is a practical check, not proof that an instrument is valid.
Reading the results
These experiments show what follows from each stated graph and set of assumptions. They do not tell us whether those assumptions describe a particular market; that judgment still depends on subject knowledge and study design.
Notebooks
All three notebooks are public and have passed full execution checks.
| 1. Compare safe and unsafe adjustment choices — Effect estimates and graph checks |
| 2. Recover an effect through a mediator — Identification diagnostics |
| 3. Examine the effect of weak instruments — Stability figures and summary tables |