- Published on
Probability of Backtest Overfitting
Trying many strategies raises the chance of selecting a lucky backtest. The notebooks use symmetric time splits to compare each in-sample winner with its complementary out-of-sample ranking.
The central relation
The estimated probability of backtest overfitting is
is the number of symmetric split combinations and is the logit of the selected trial’s relative out-of-sample rank. A nonpositive logit places that winner in the lower half of the out-of-sample ranking.
How trial selection changes backtest evidence
The split map shows how complementary samples are formed. The public sensitivity plot shows how the reported PBO changes with the number of time groups and trials.
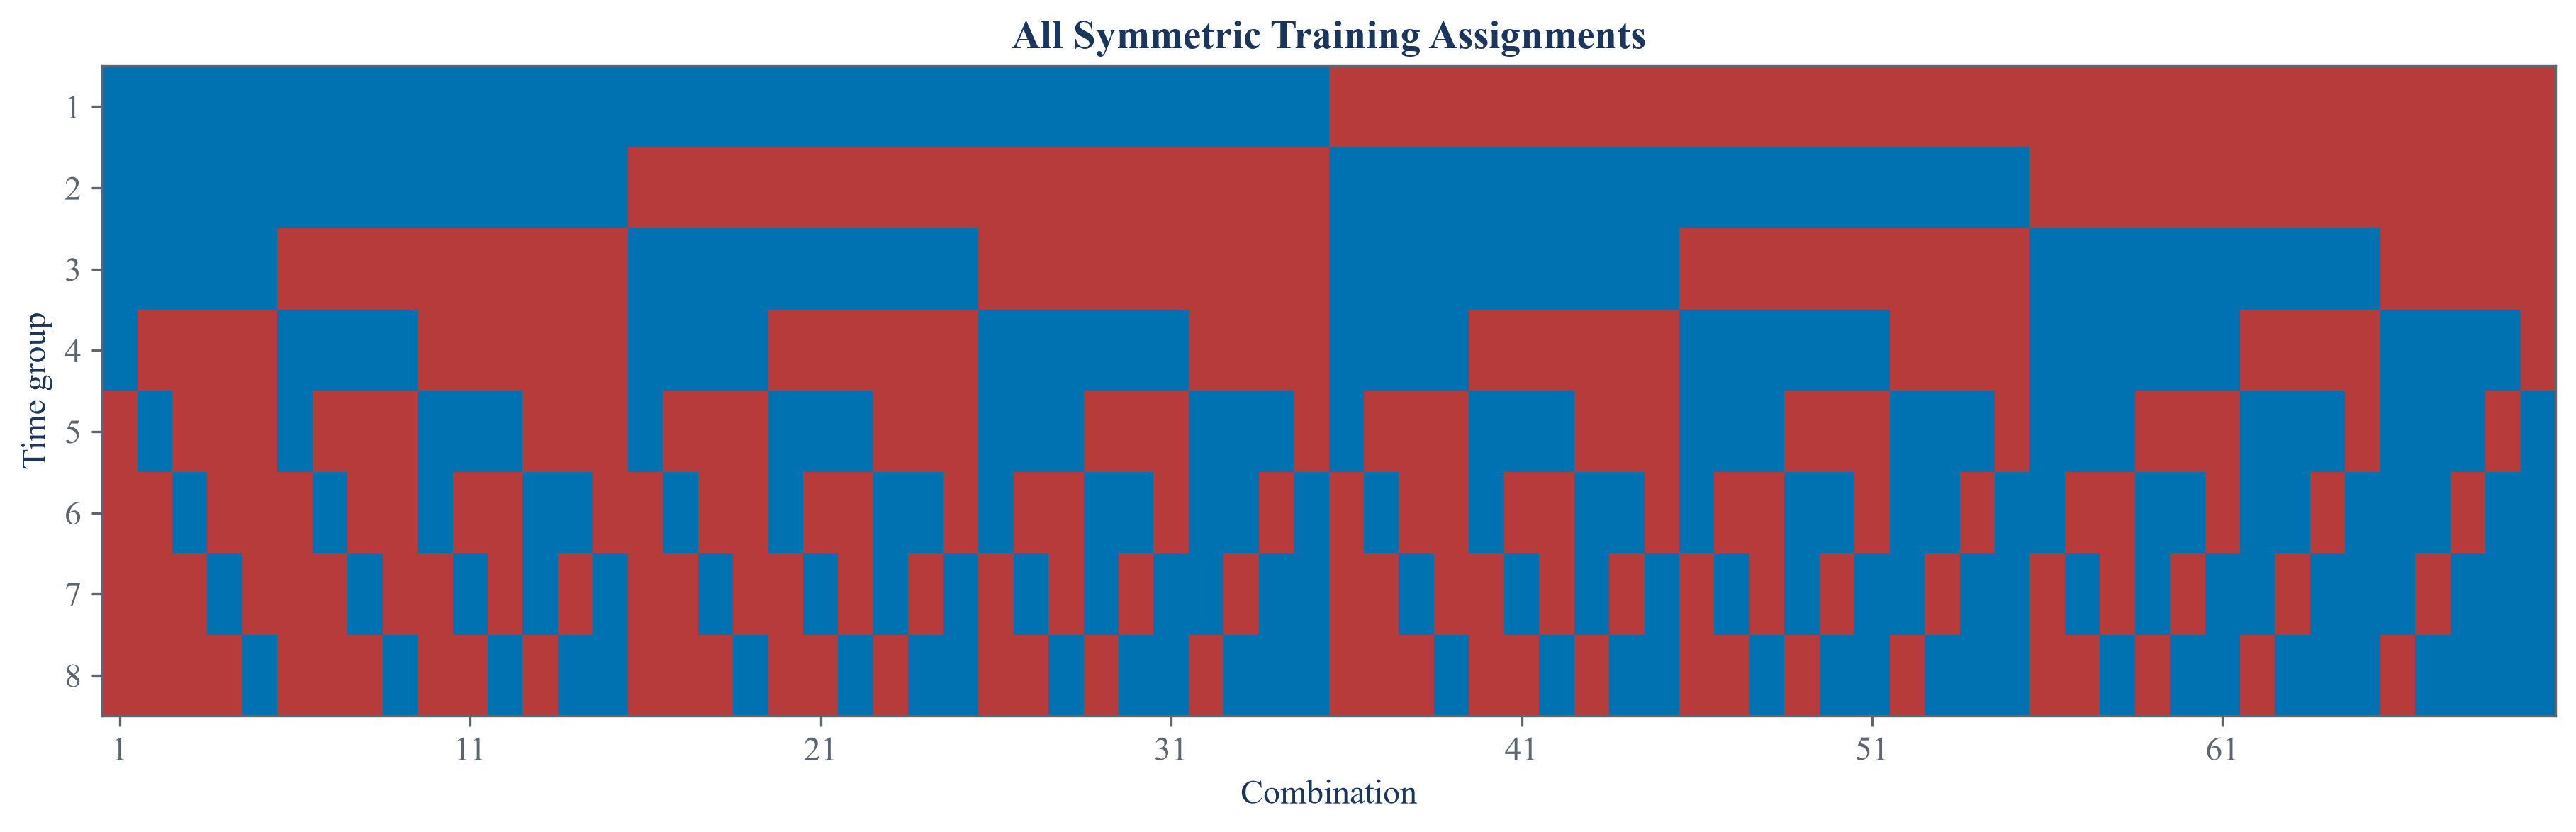
Each selection sample has a complementary evaluation sample of the same size. The roles reverse across paired combinations.
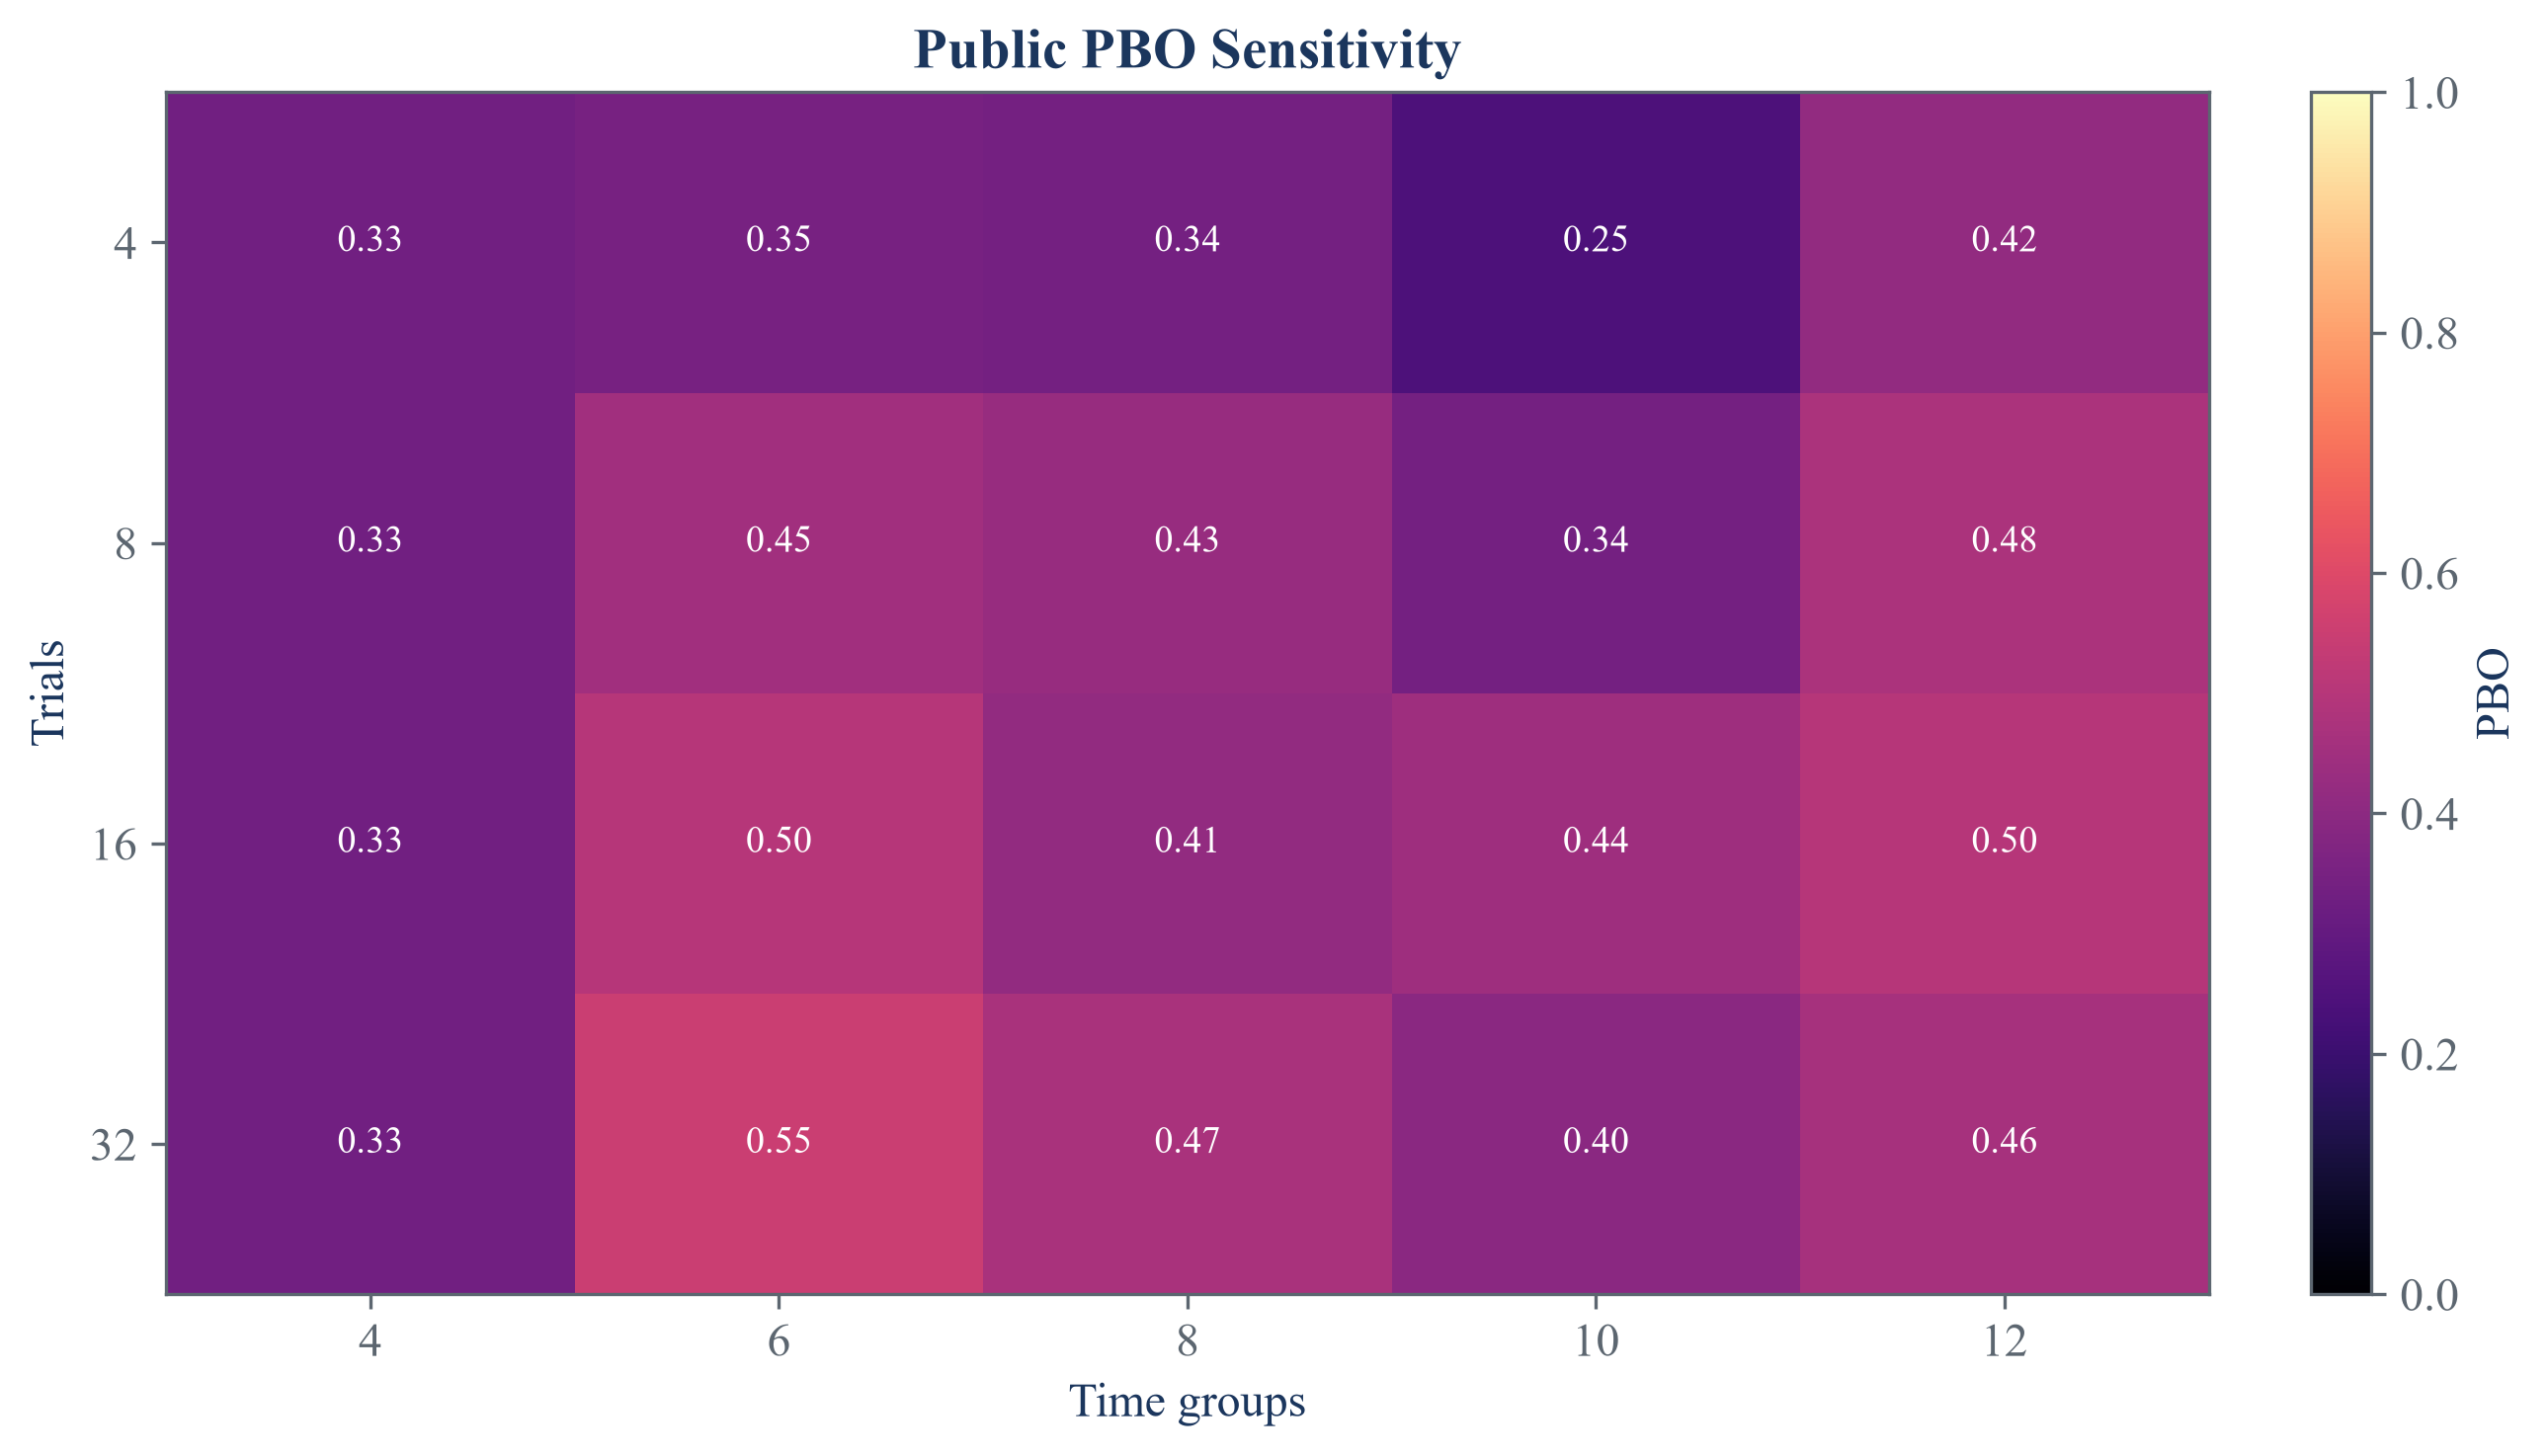
The sensitivity result shows that PBO is a property of the declared trial family and split design, not a fixed attribute of one return series.
PBO describes the selection exercise that was actually recorded. Unreported trials cannot be recovered from the calculation.
Notebooks
| 1. Combinatorially Symmetric Cross-Validation |
| 2. Defining PBO from out-of-sample ranks |
| 3. Studying PBO in finite samples |