- Published on
Adjusting Sharpe Inference for Multiple Testing
A high sample Sharpe ratio may arise from sampling error, serial dependence, non-normal returns, or a large search over strategies. The notebooks examine these effects separately and then combine them in adjusted comparisons.
The central relation
The per-period sample Sharpe ratio is
is the return at observation , is the sample size, is the sample mean, and is the sample standard deviation. Later calculations adjust the reference Sharpe and uncertainty for the search and return properties.
How multiple testing changes Sharpe evidence
The probabilistic curves show how confidence changes with sample size and higher moments. The public result compares ordinary and deflated Sharpe assessments across tried strategies.
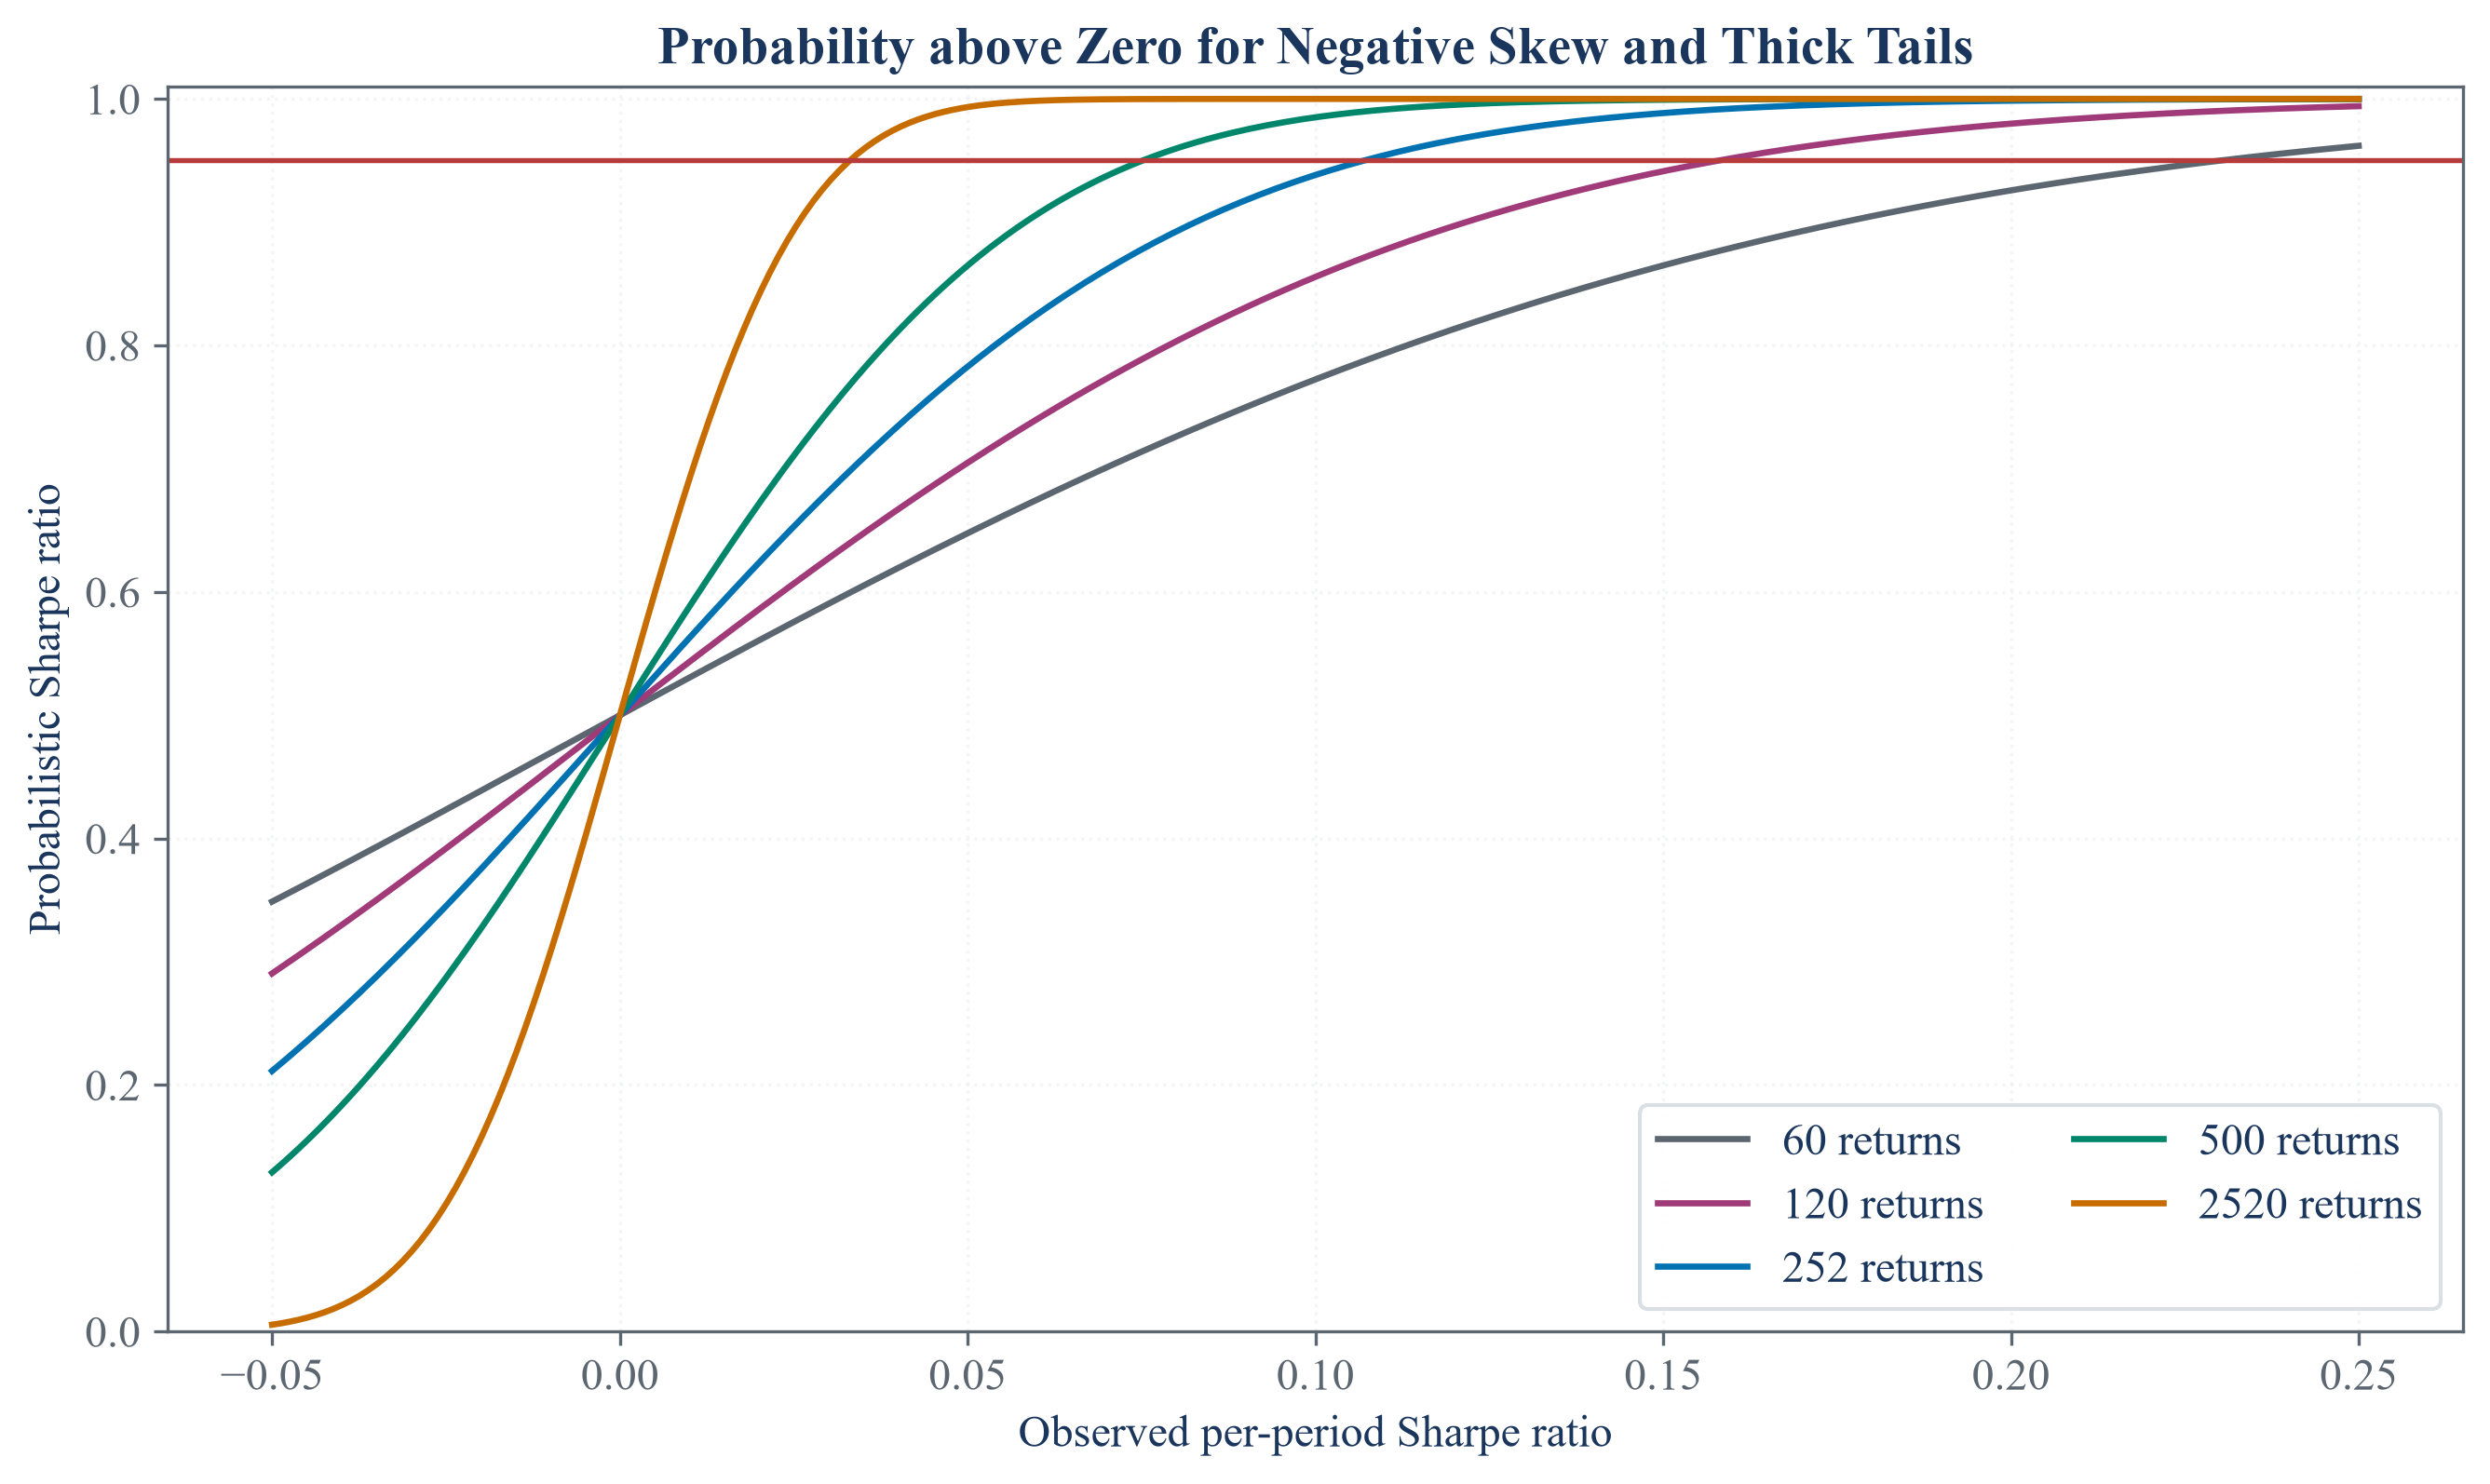
The probability changes with the observed Sharpe, sample length, return skewness, and kurtosis rather than depending on the ratio alone.
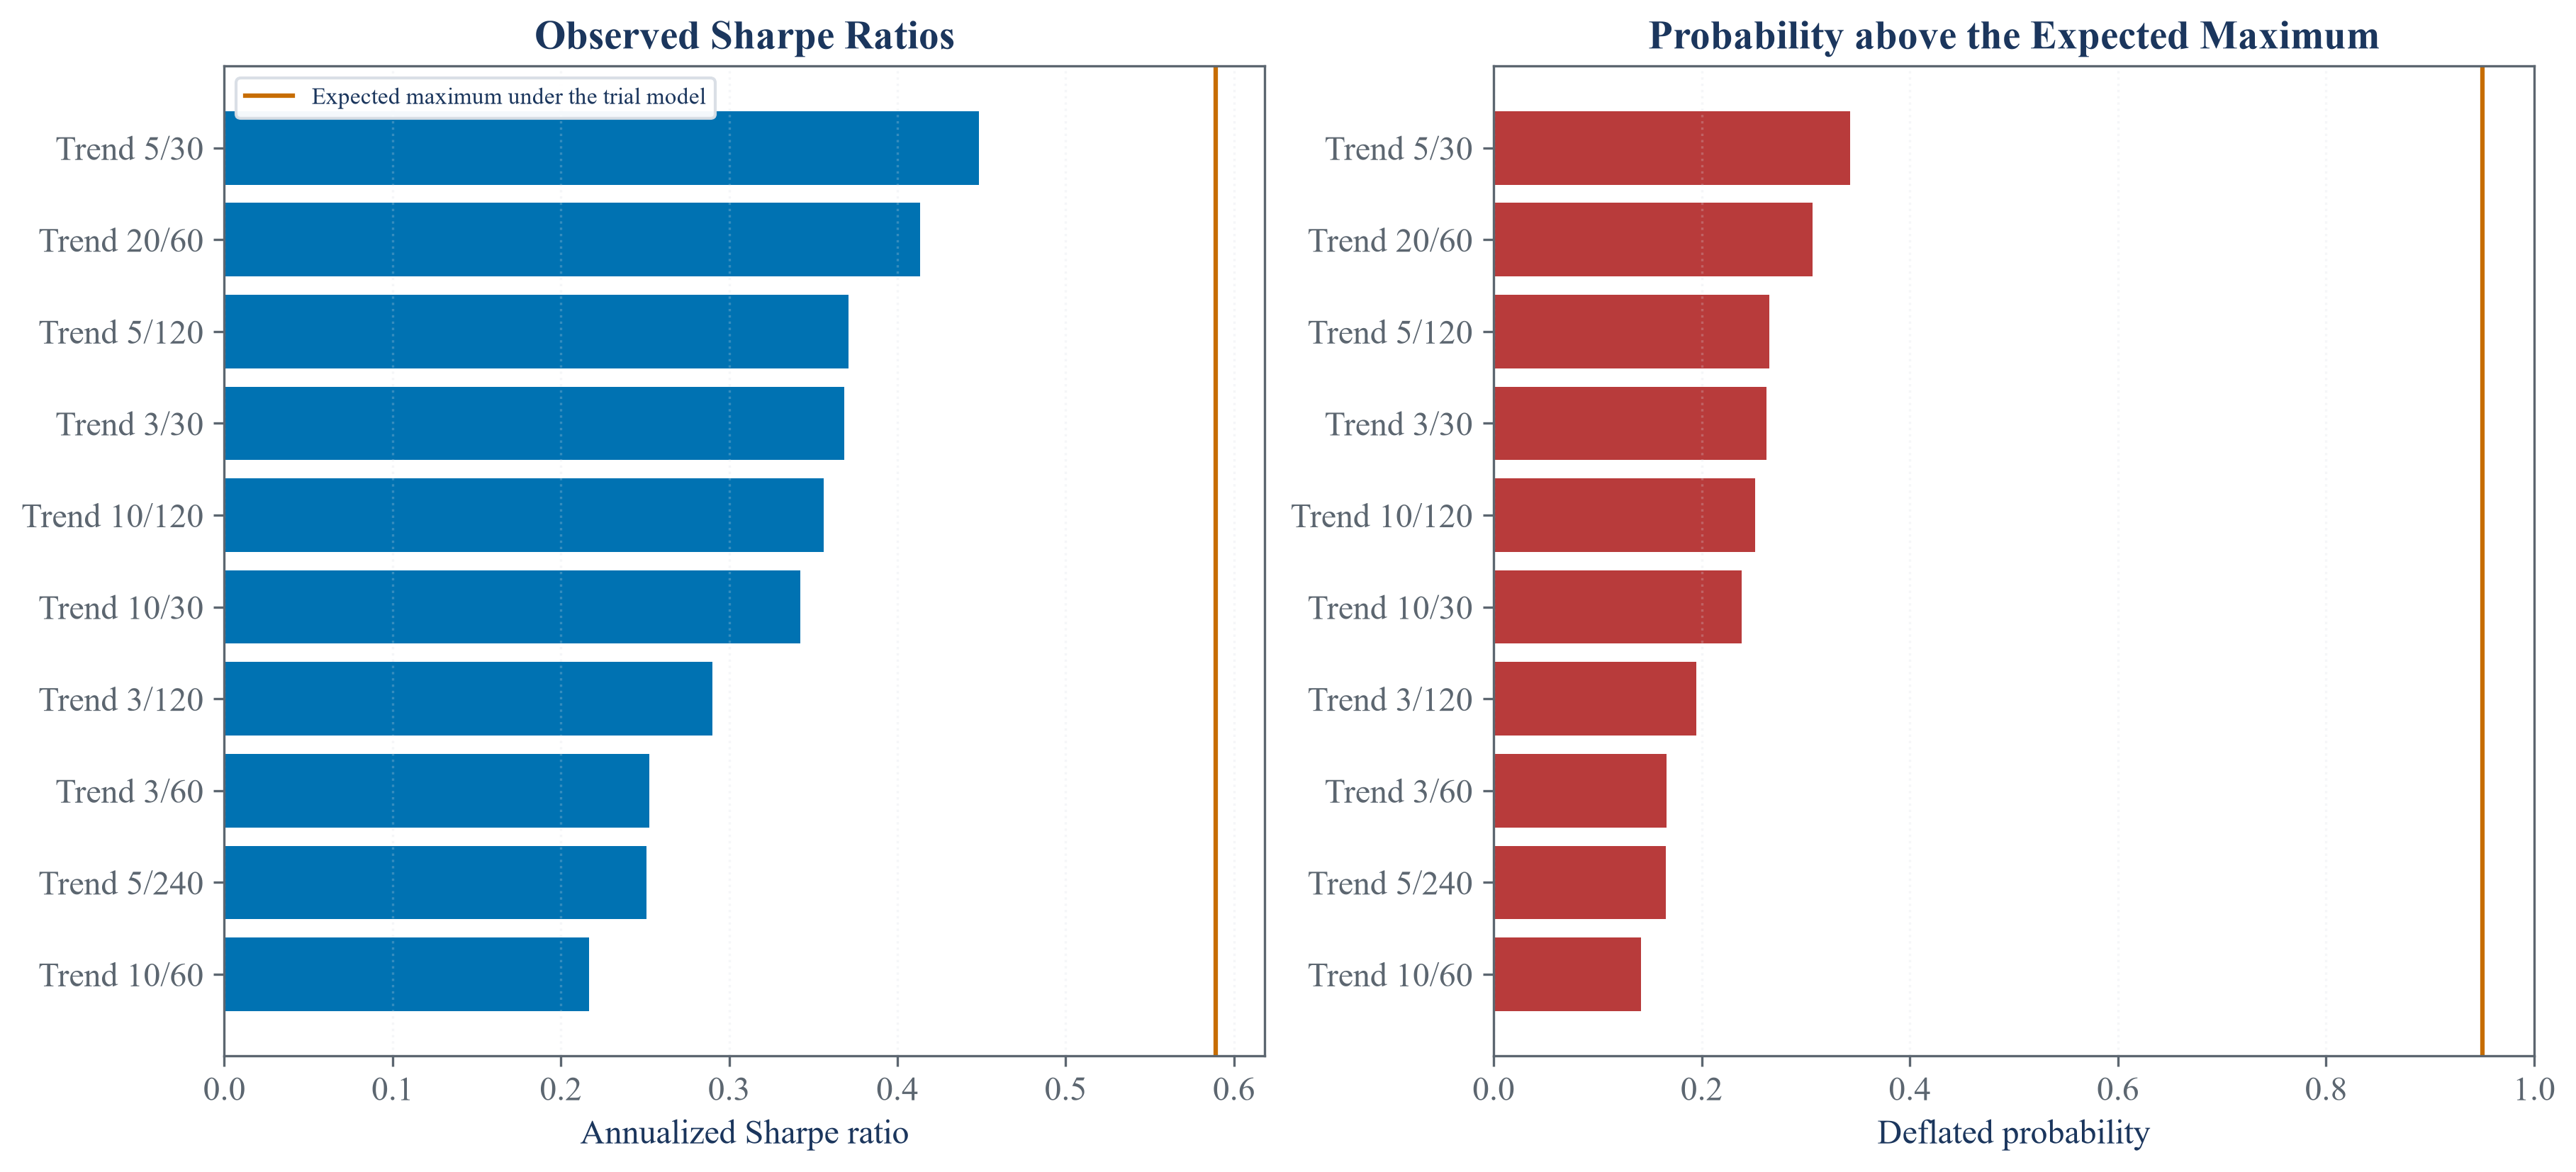
The deflated comparison raises the benchmark when many trials were considered, making the search part of the evidence assessment.
An adjusted statistic can reduce an exaggerated claim, but it cannot reconstruct trials that were not recorded or repair a biased return history.
Notebooks
| 1. From probabilistic to deflated Sharpe ratios |
| 2. Dependence-Robust Sharpe Comparisons |
| 3. Correcting performance claims for multiple testing |