- Published on
Measuring Tail Risk from Extreme Events
Tail analysis focuses on losses beyond an explicit threshold. The notebooks fit a generalized Pareto model, compare value at risk with expected shortfall and drawdown, and evaluate forecasts on later observations.
The central relation
For excess loss above threshold , the generalized Pareto survival law is
is loss, is the threshold, and is an excess. The scale sets the size of excesses and the shape controls how slowly the fitted tail declines, on values where the expression is defined.
Testing tail forecasts on later losses
The mean-excess diagnostic helps assess threshold behavior. The held-out plot then compares forecasts fixed from the design sample with later realized losses.
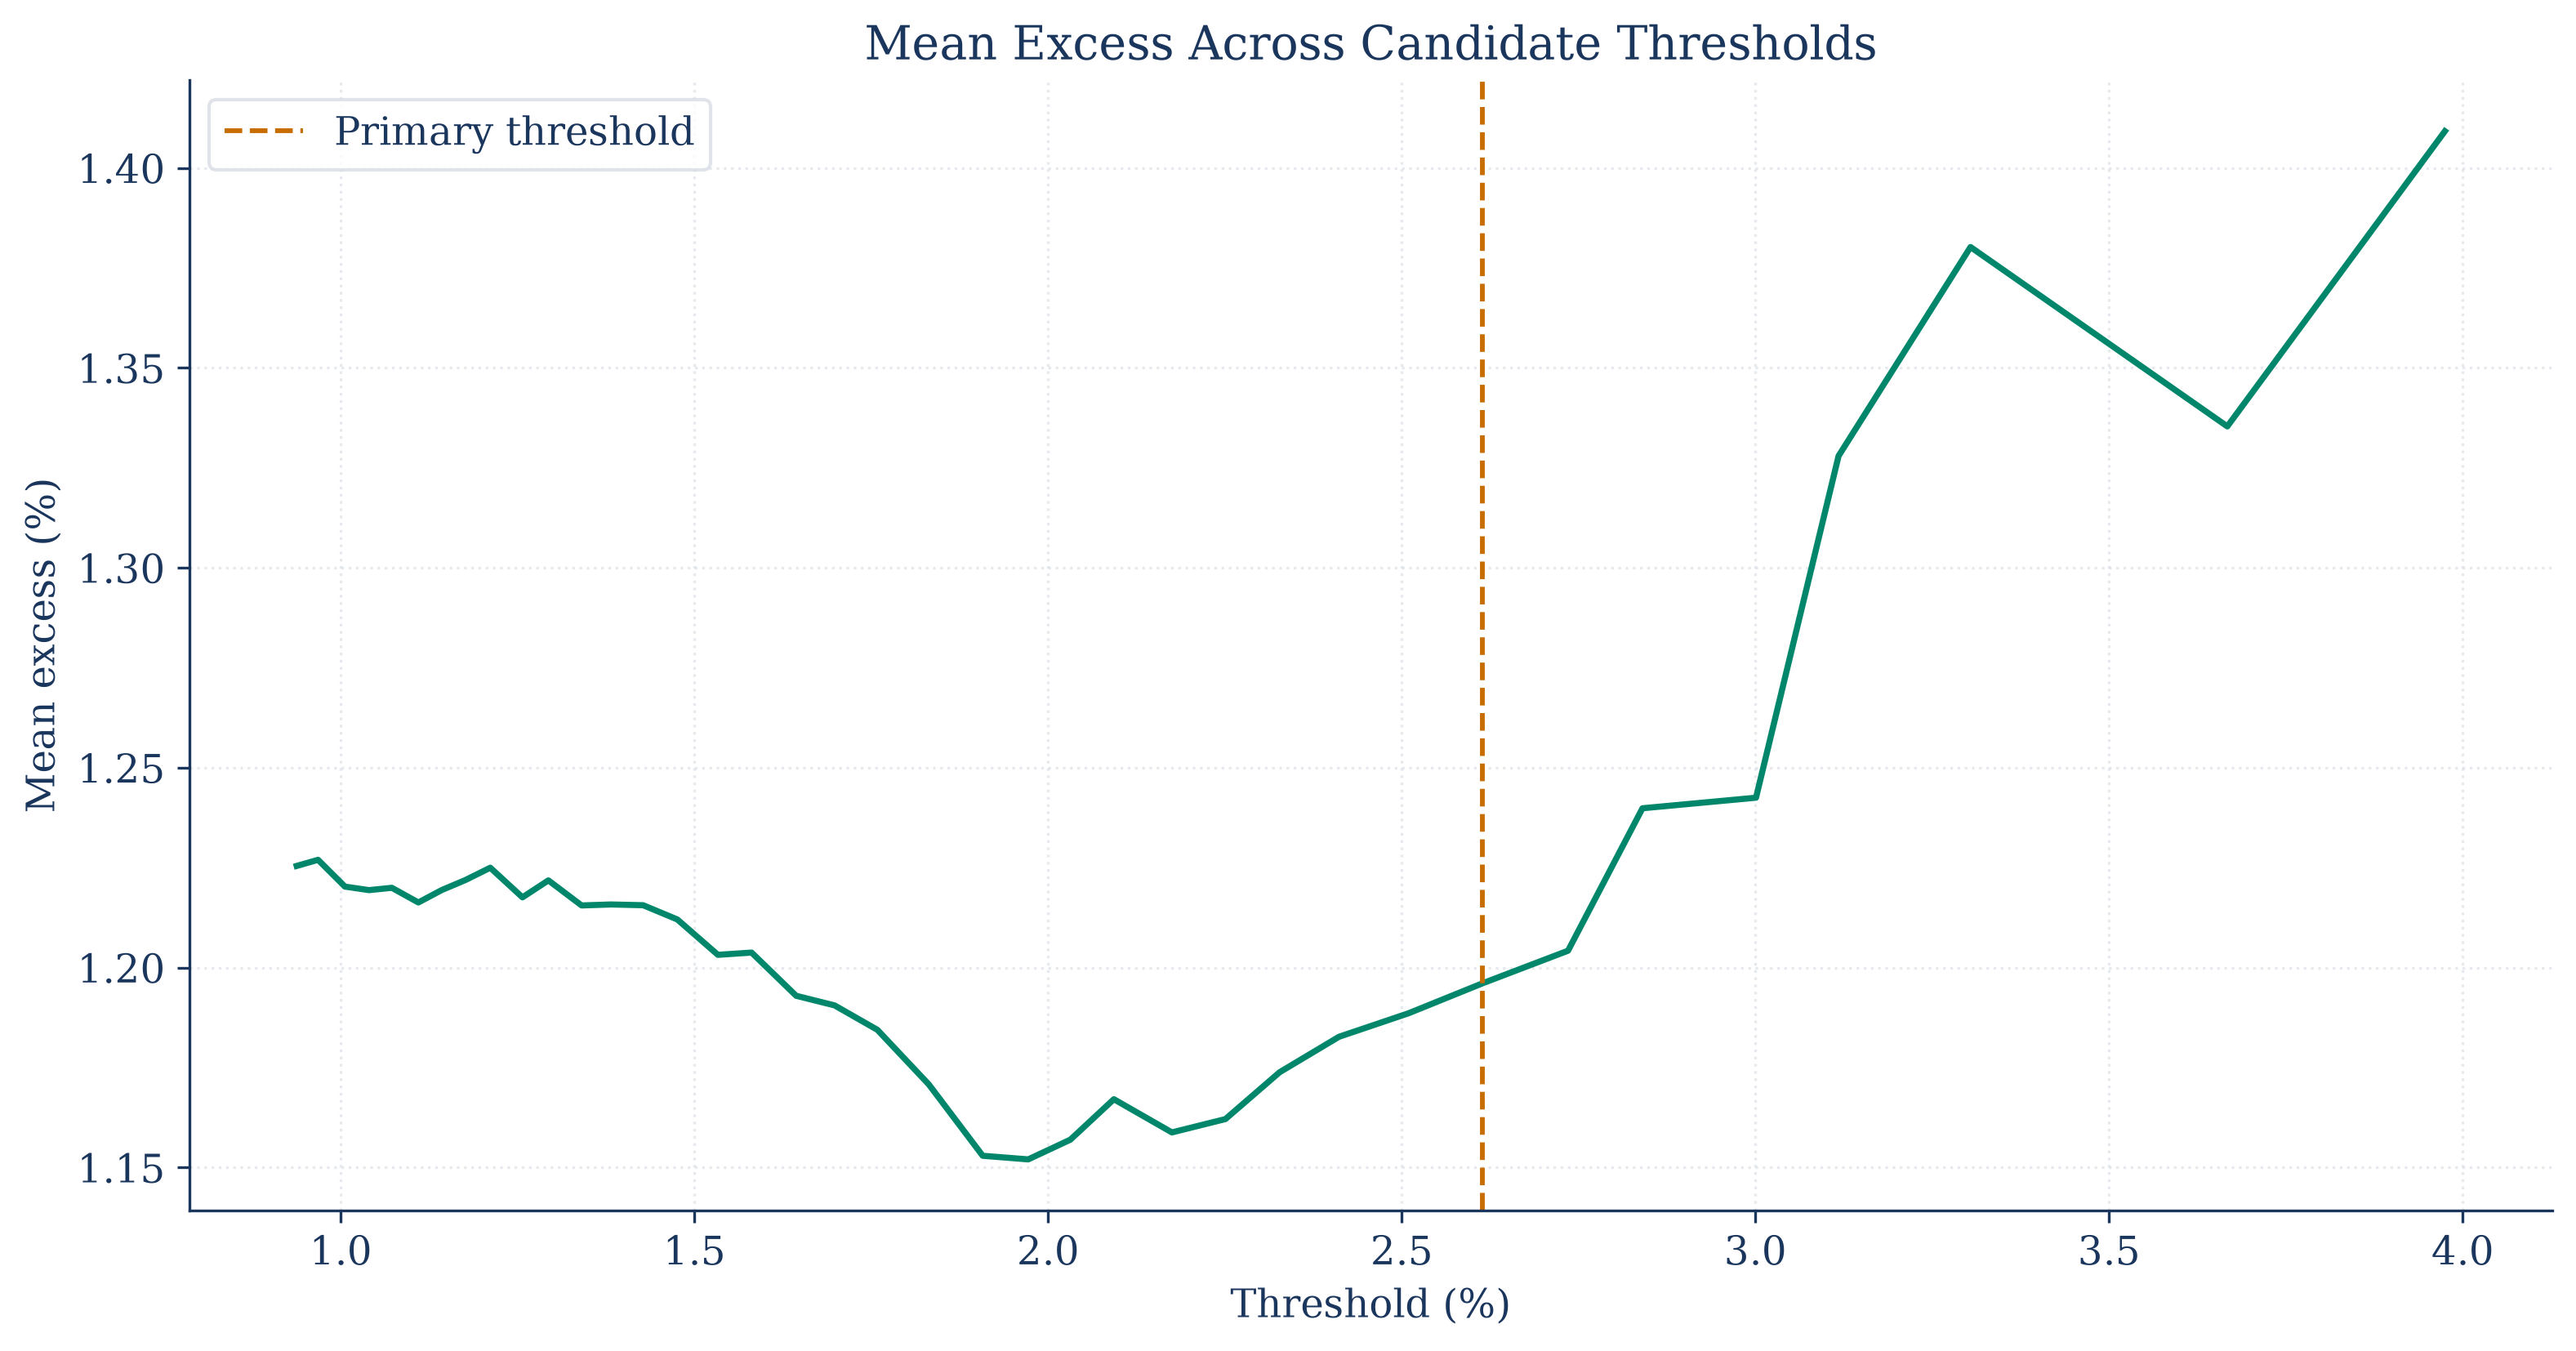
The mean-excess curve is one diagnostic for choosing a region where a Pareto approximation may be reasonable. It is read together with parameter stability and sample size.
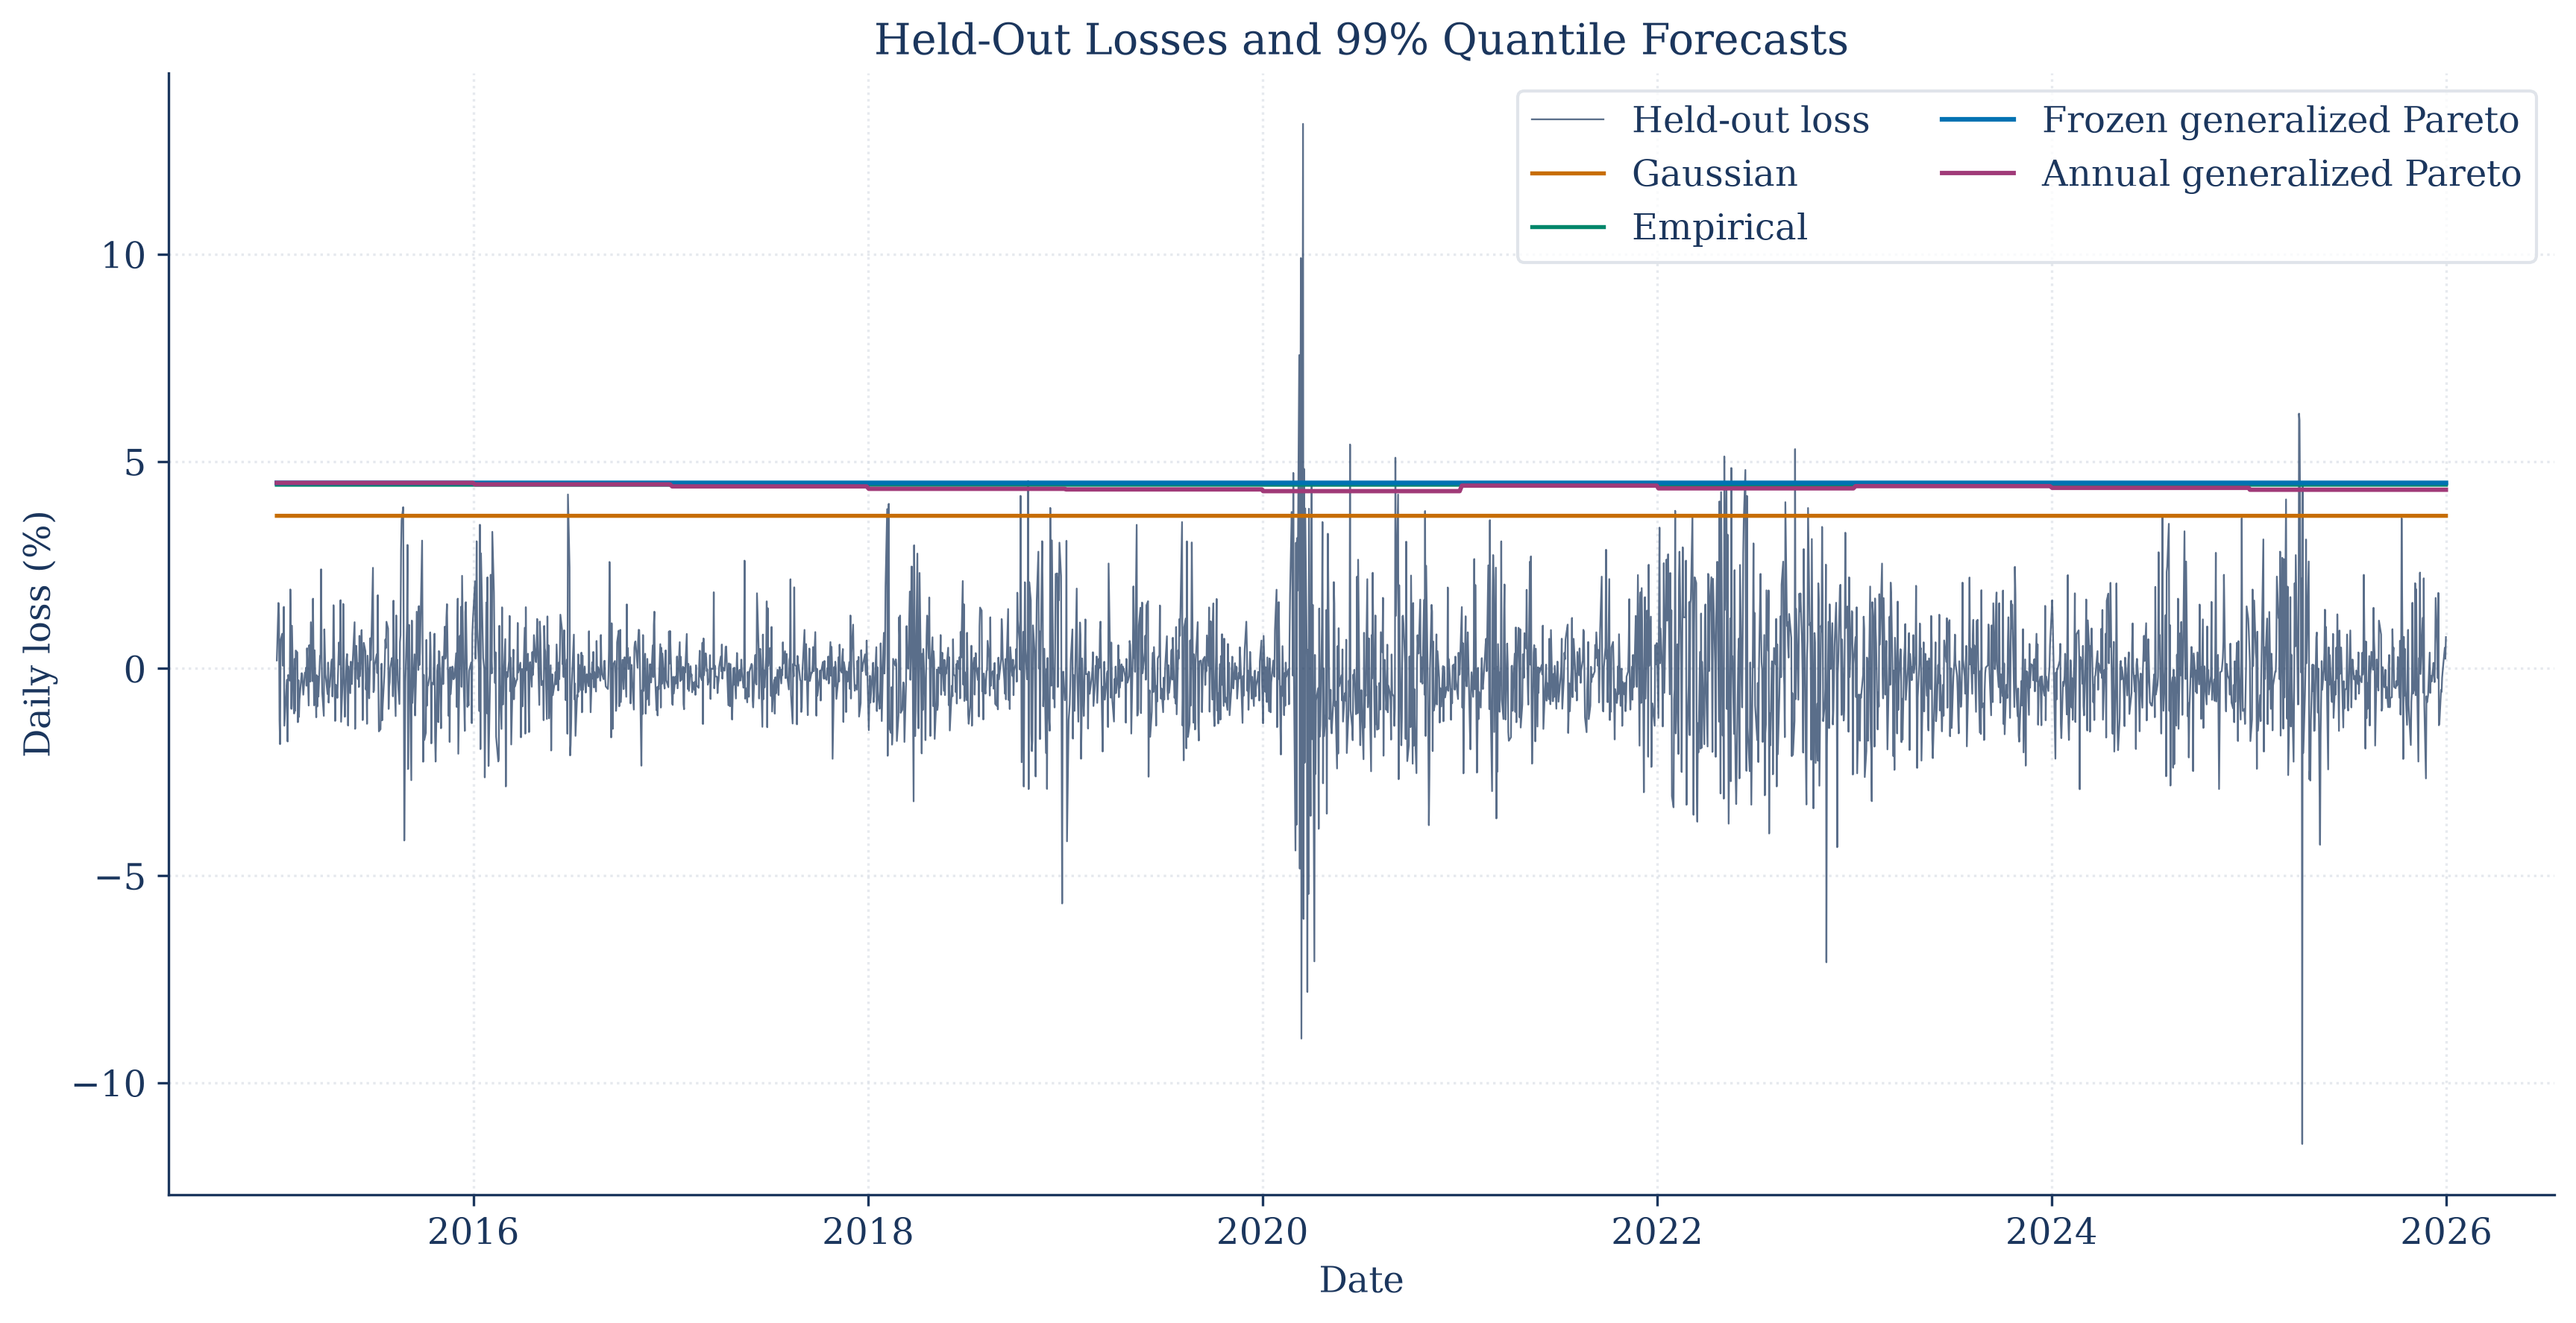
The forecast lines are set without using held-out losses. Exceptions and their timing can then be examined on the later period.
Tail estimates are sensitive to threshold choice and the limited number of extremes. The notebooks report those sensitivities rather than treating one fitted tail as exact.
Notebooks
| 1. Loss Tails Above a Threshold |
| 2. Comparing three views of downside risk |
| 3. Testing a Sequence of Risk Forecasts |