- Published on
Denoising High-Dimensional Covariance Matrices
When the number of assets is large relative to the number of dates, sample covariance estimates become unstable. The notebooks inspect the eigenvalue spectrum, clean the noisy part, and test the effect on portfolio weights and risk.
The central relation
For centered return matrix , the sample covariance is
contains dates and assets, is the by sample covariance matrix, and the rank limit records how many independent directions the sample can identify.
Separating covariance signal from estimation noise
The spectrum plot compares sample eigenvalues with the estimated noise region. The rolling experiment shows how cleaning changes portfolio-weight stability.
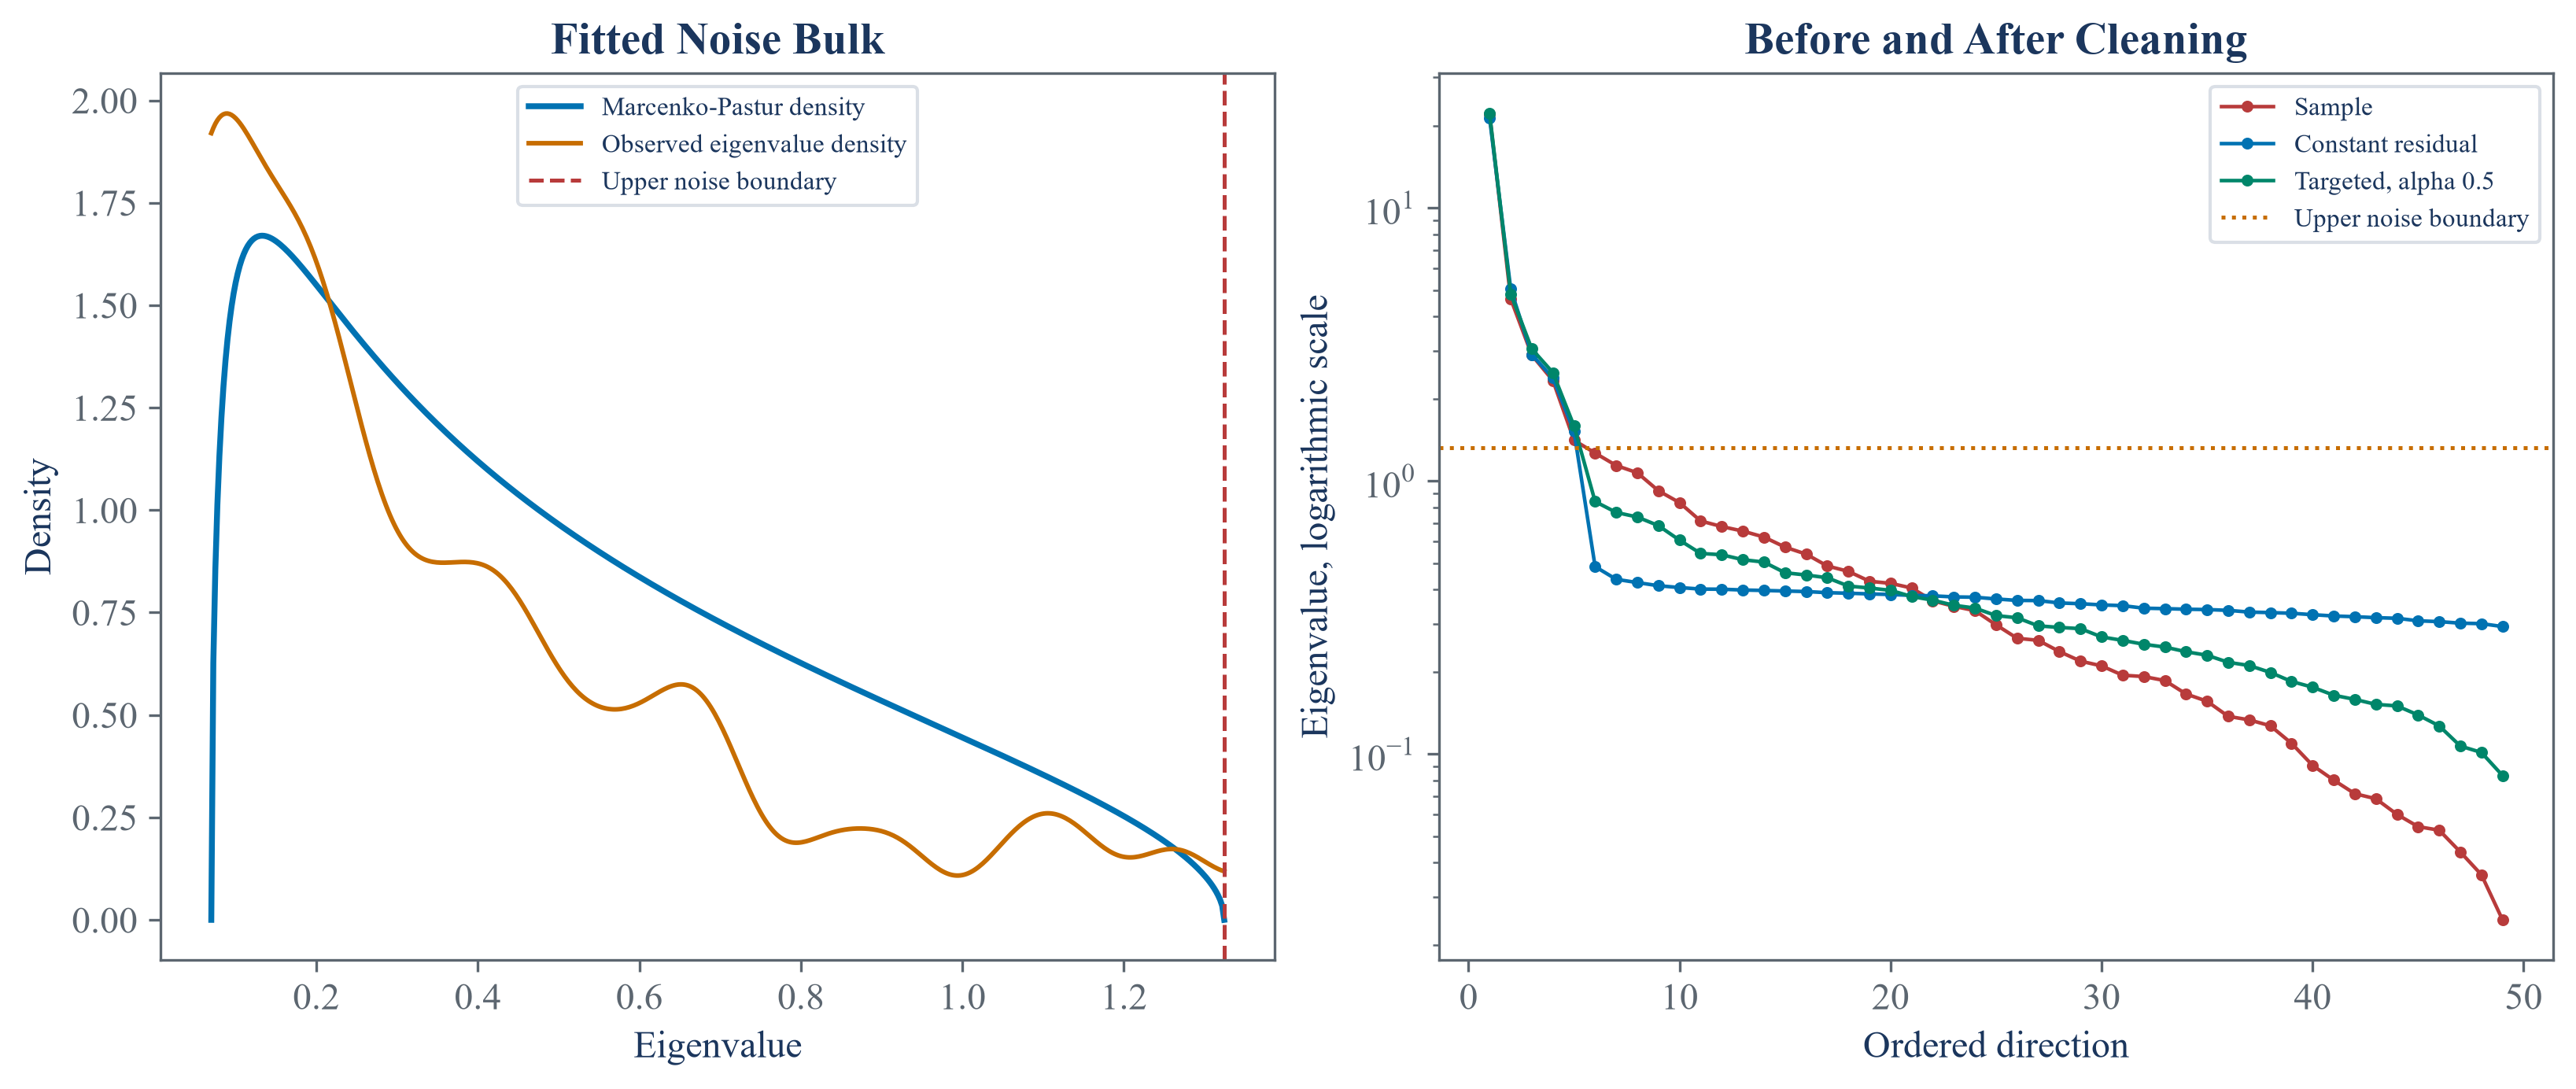
Eigenvalues inside the estimated noise region are not interpreted one by one. The cleaning rule treats their shared level separately from stronger directions.
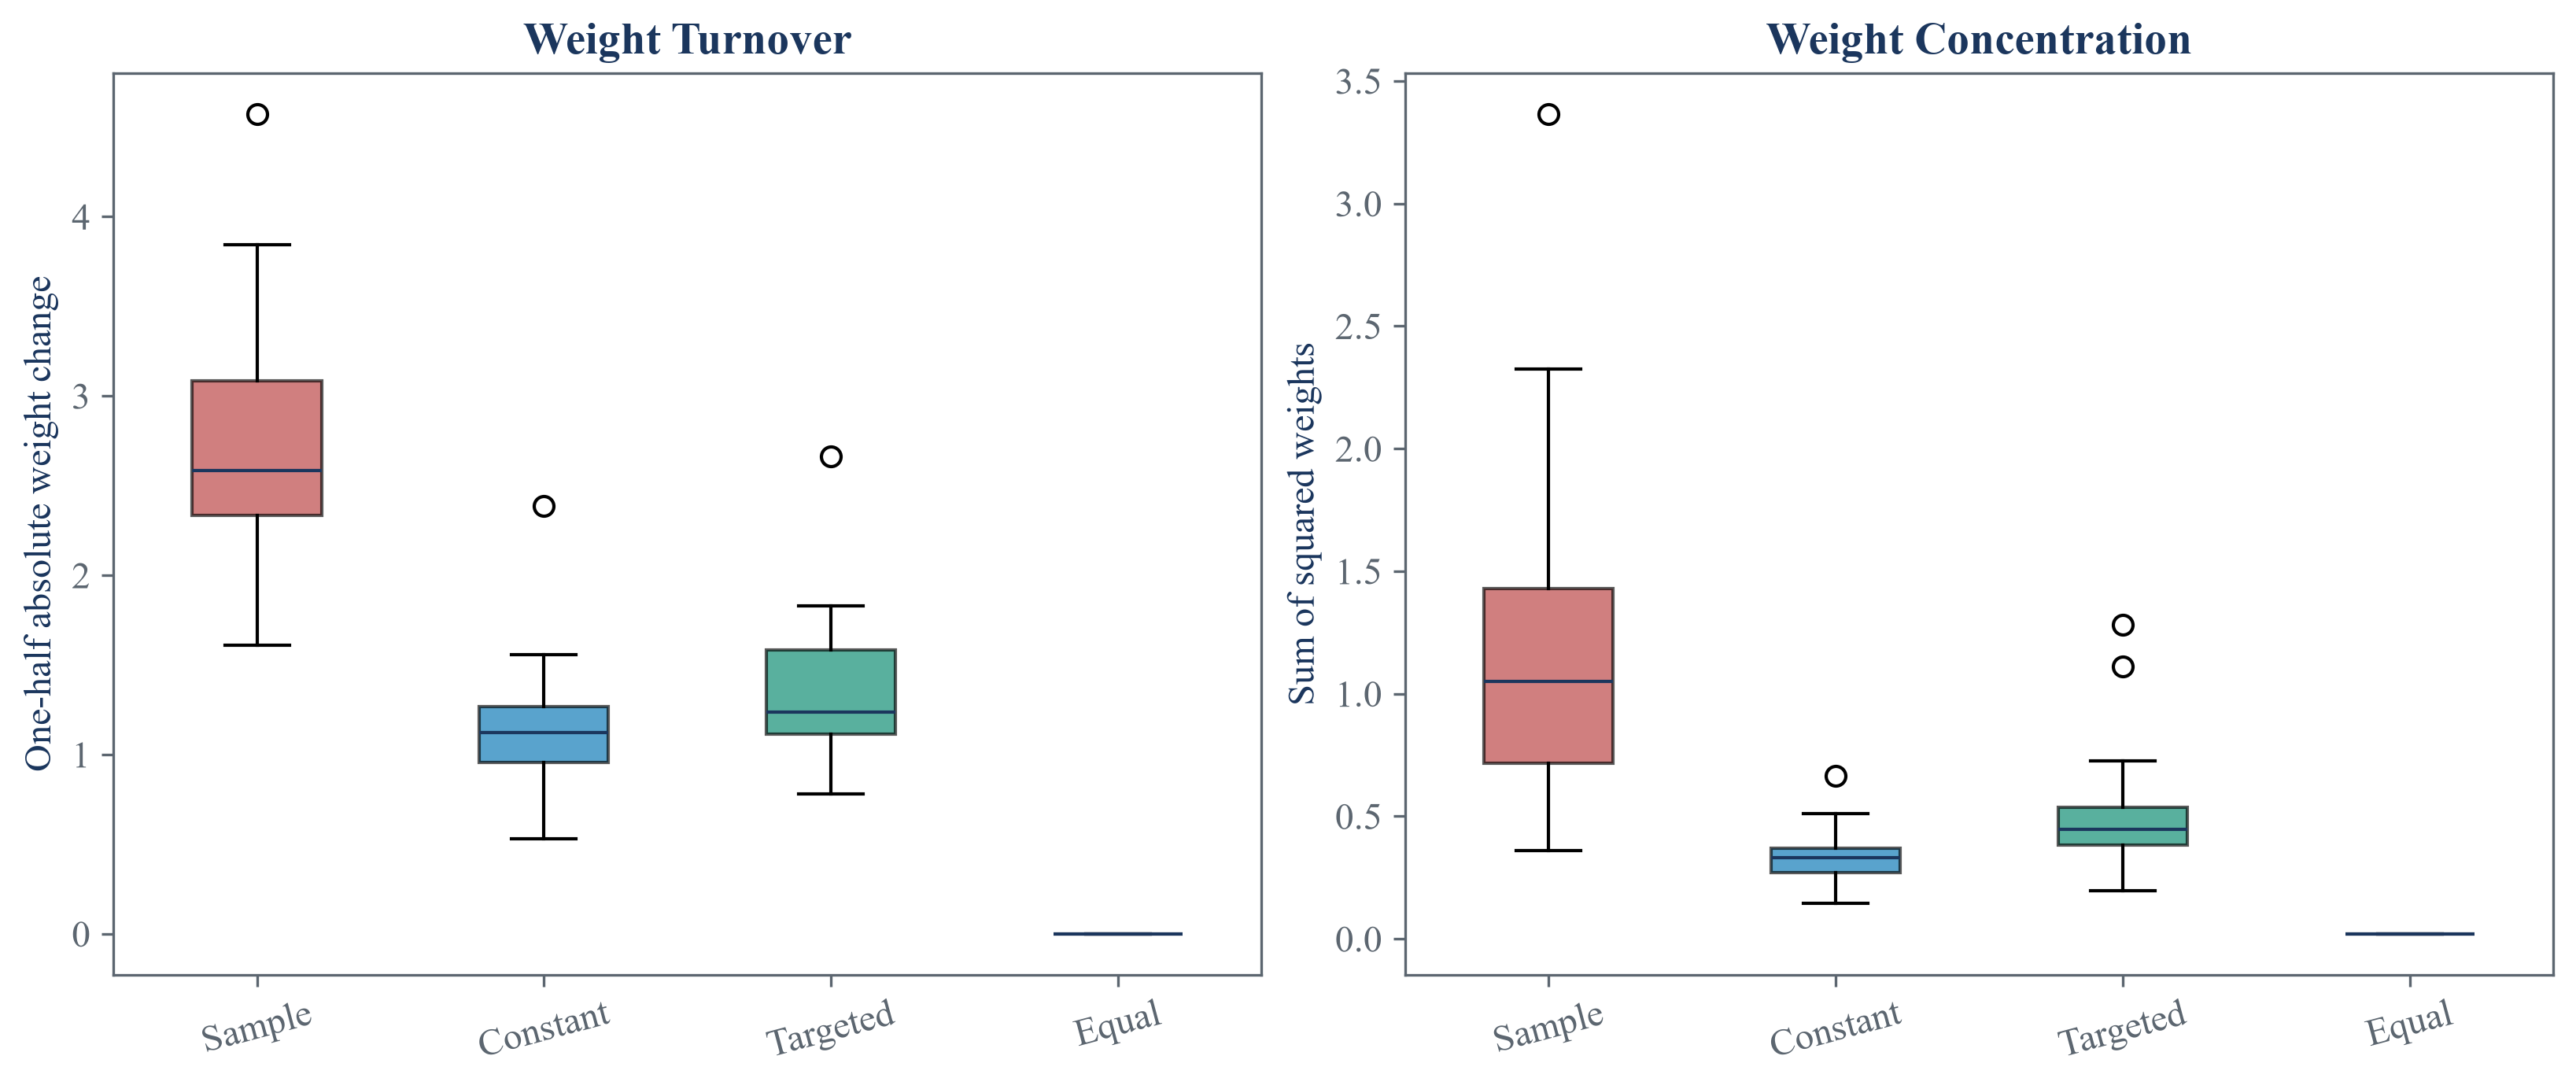
The rolling comparison measures how strongly portfolio weights change when the estimation window moves through public observations.
Denoising reduces one source of estimation variation. It cannot recover a covariance structure that is absent from the sample or stable only under an incorrect model.
Notebooks
| 1. Sample Covariance When Variables Are Many |
| 2. Separating signal eigenvalues from noise |
| 3. Testing portfolio sensitivity to covariance cleaning |