- Published on
Measuring Dependence with Geometry and Information
Correlation measures one form of association. Distance and information measures offer different views, especially when dependence is nonlinear. The notebooks compare these measures under known cases and public returns.
The central relation
Correlation can be converted into an angular distance by
and are paired series and is their correlation. The first distance distinguishes positive from negative association; the second treats correlations of equal magnitude as equally close.
Detecting dependence beyond linear correlation
Known dependence cases reveal which measures respond to nonlinear structure. The public-data scatter then compares geometry and information across return pairs.
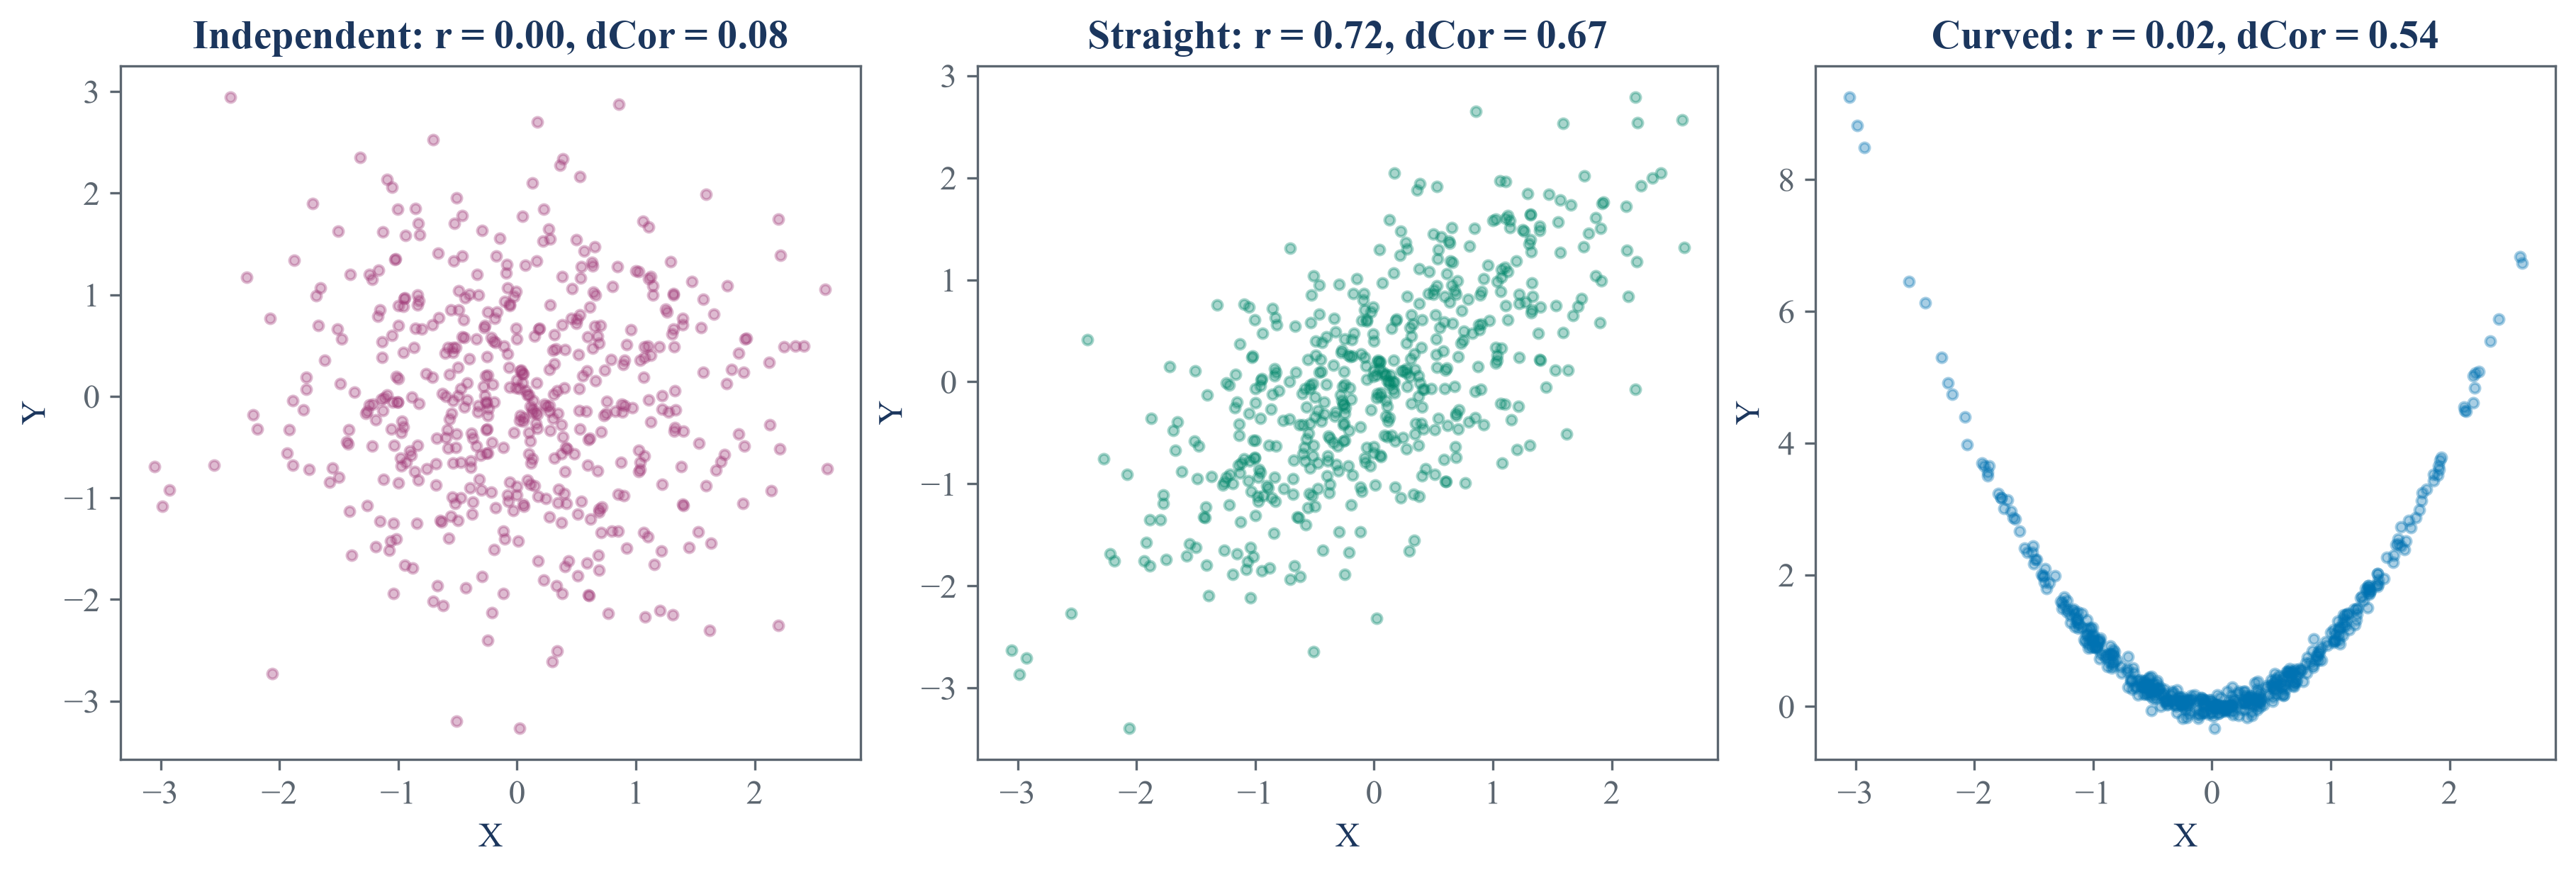
The controlled cases show that a low linear correlation can coexist with visible nonlinear dependence detected by an information measure.
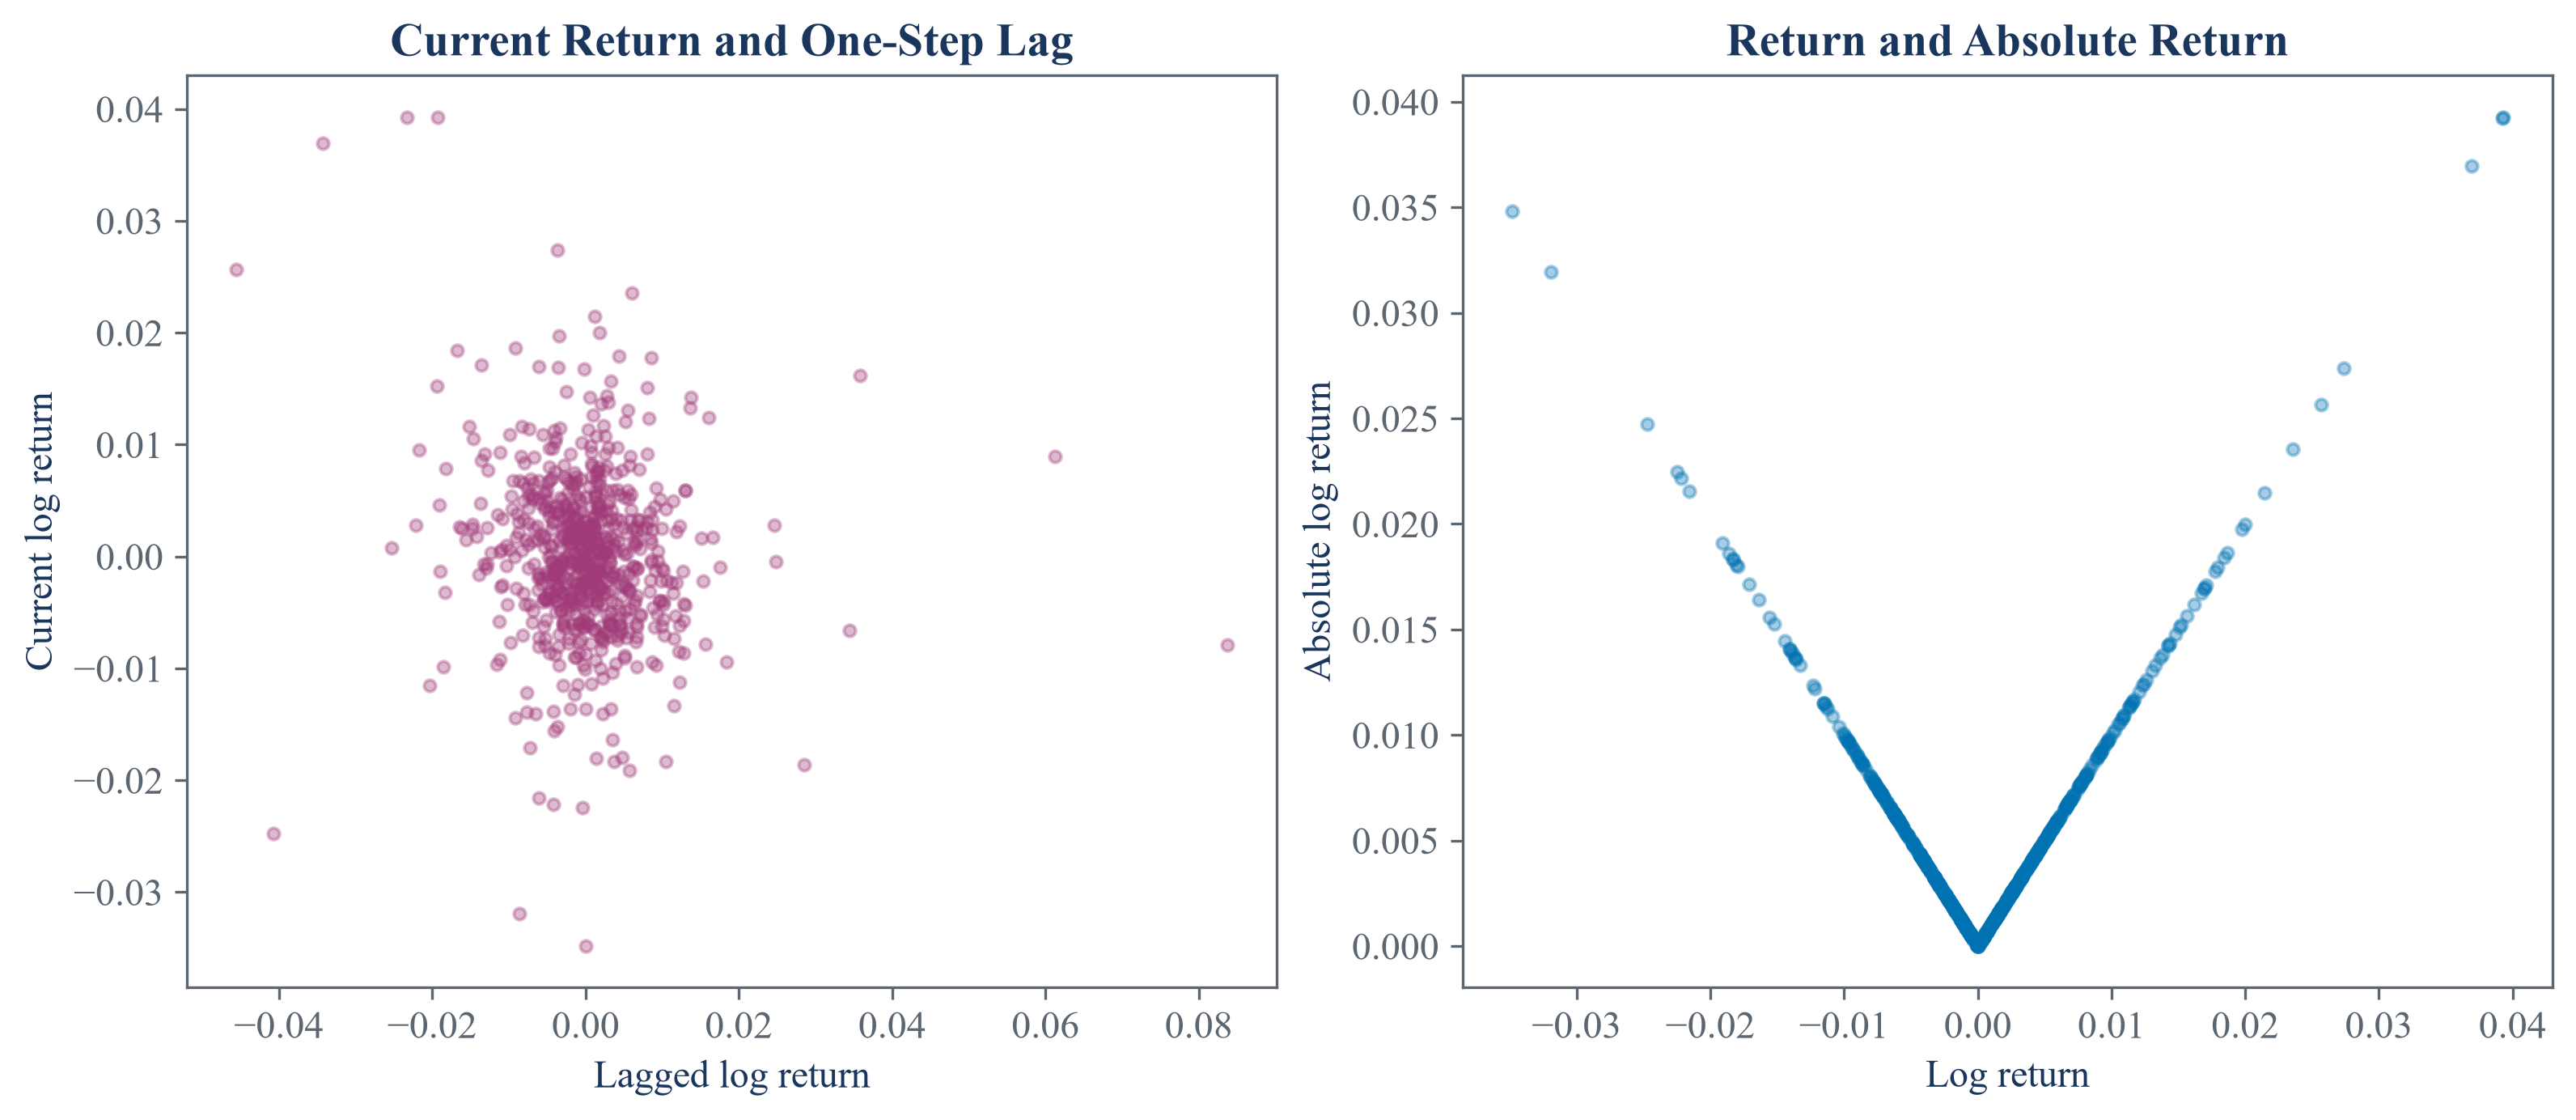
Each point is a public return pair measured in two ways. Differences between the axes identify pairs whose relation is not summarized by correlation alone.
Every dependence measure answers a particular question and has finite-sample error. The entropy notebooks therefore include bin and bias checks alongside the reported values.
Notebooks
| 1. From correlation to angular distance |
| 2. Measuring nonlinear dependence with information |
| 3. Estimating entropy from finite samples |