- Published on
Synthetic Financial Environments
Generated data are useful when the population truth must be known. The notebooks build return systems with declared dependence and drift, then use repeated samples to measure whether a method recovers what was put into the design.
The central relation
A correlated return vector can be constructed from independent shocks by
is the simulated -dimensional return vector, is its mean, and is a standard-normal vector with identity covariance . The matrix is a square root of the target covariance .
Recovering known structure from simulated data
The first notebook checks the covariance design directly. The repeated-sample notebook then reports how much a measured quantity changes across Monte Carlo runs.
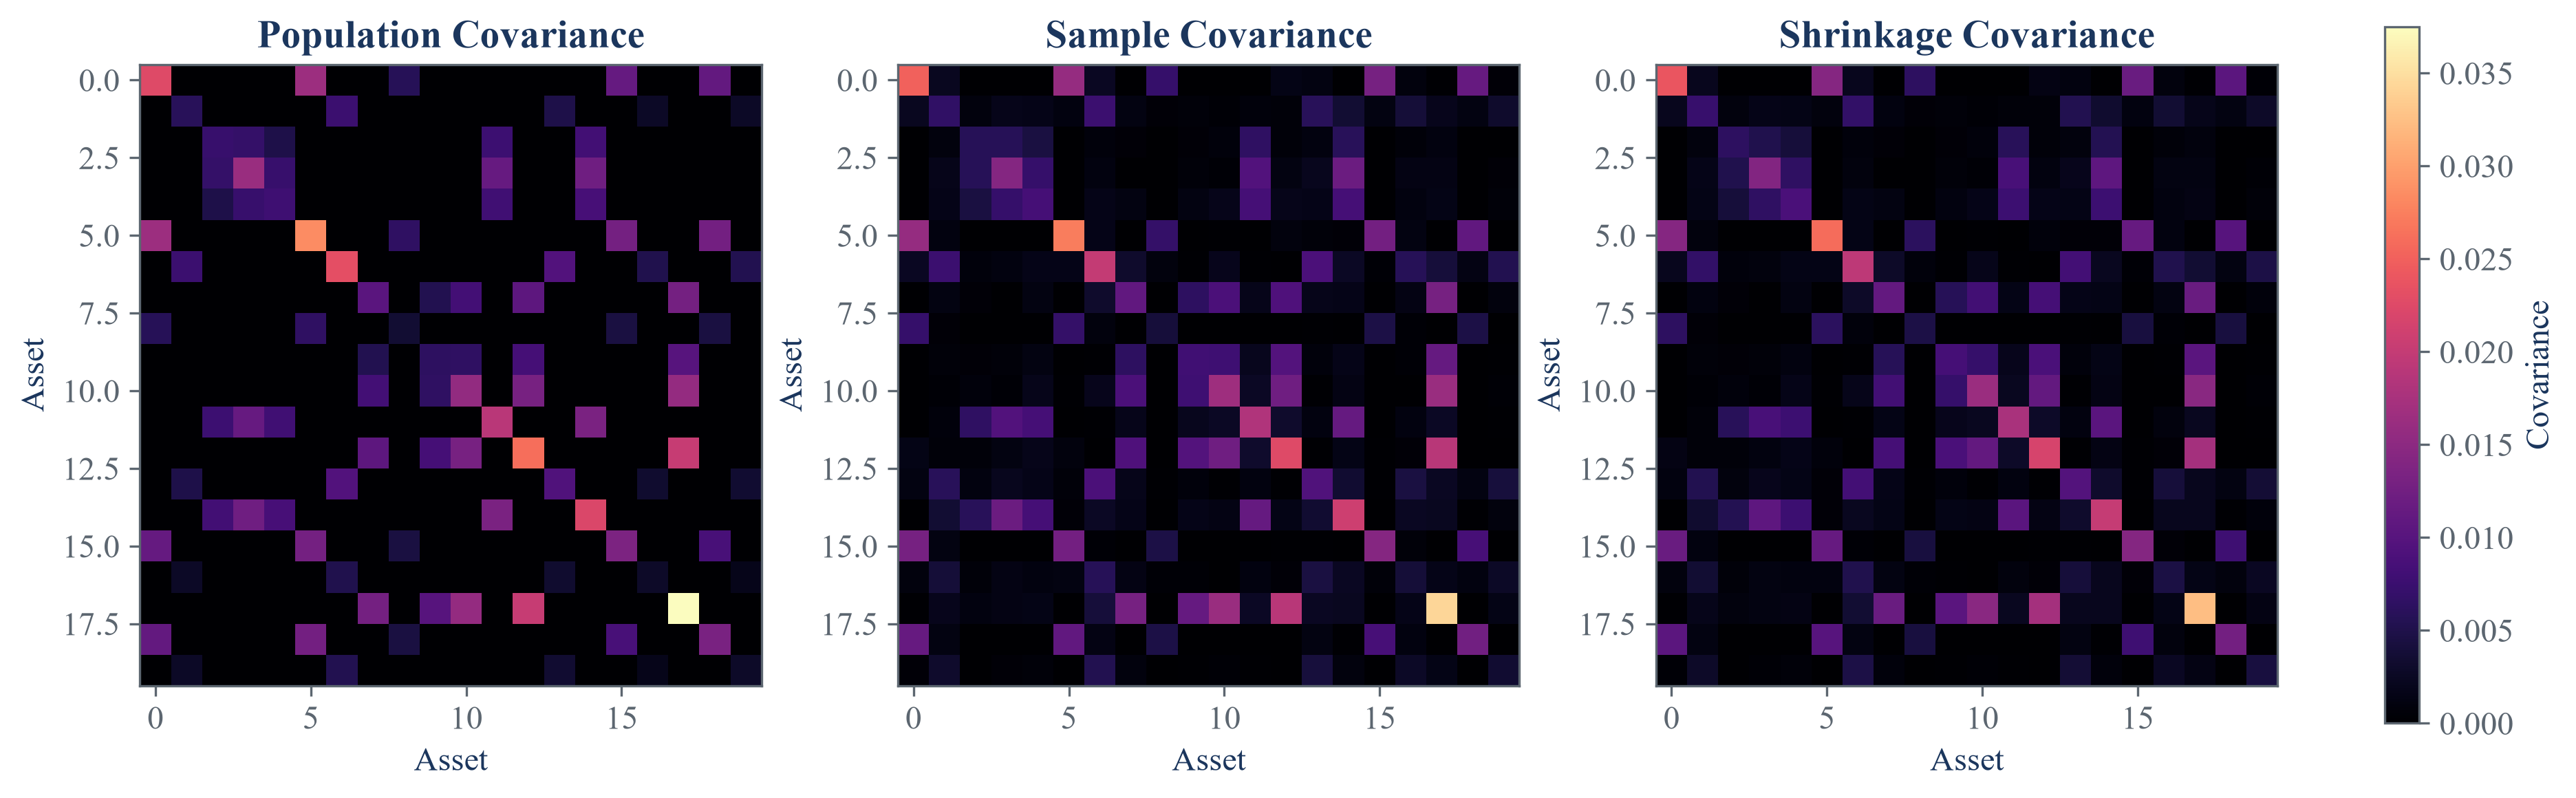
The covariance panels compare the declared dependence structure with the structure recovered from generated observations.
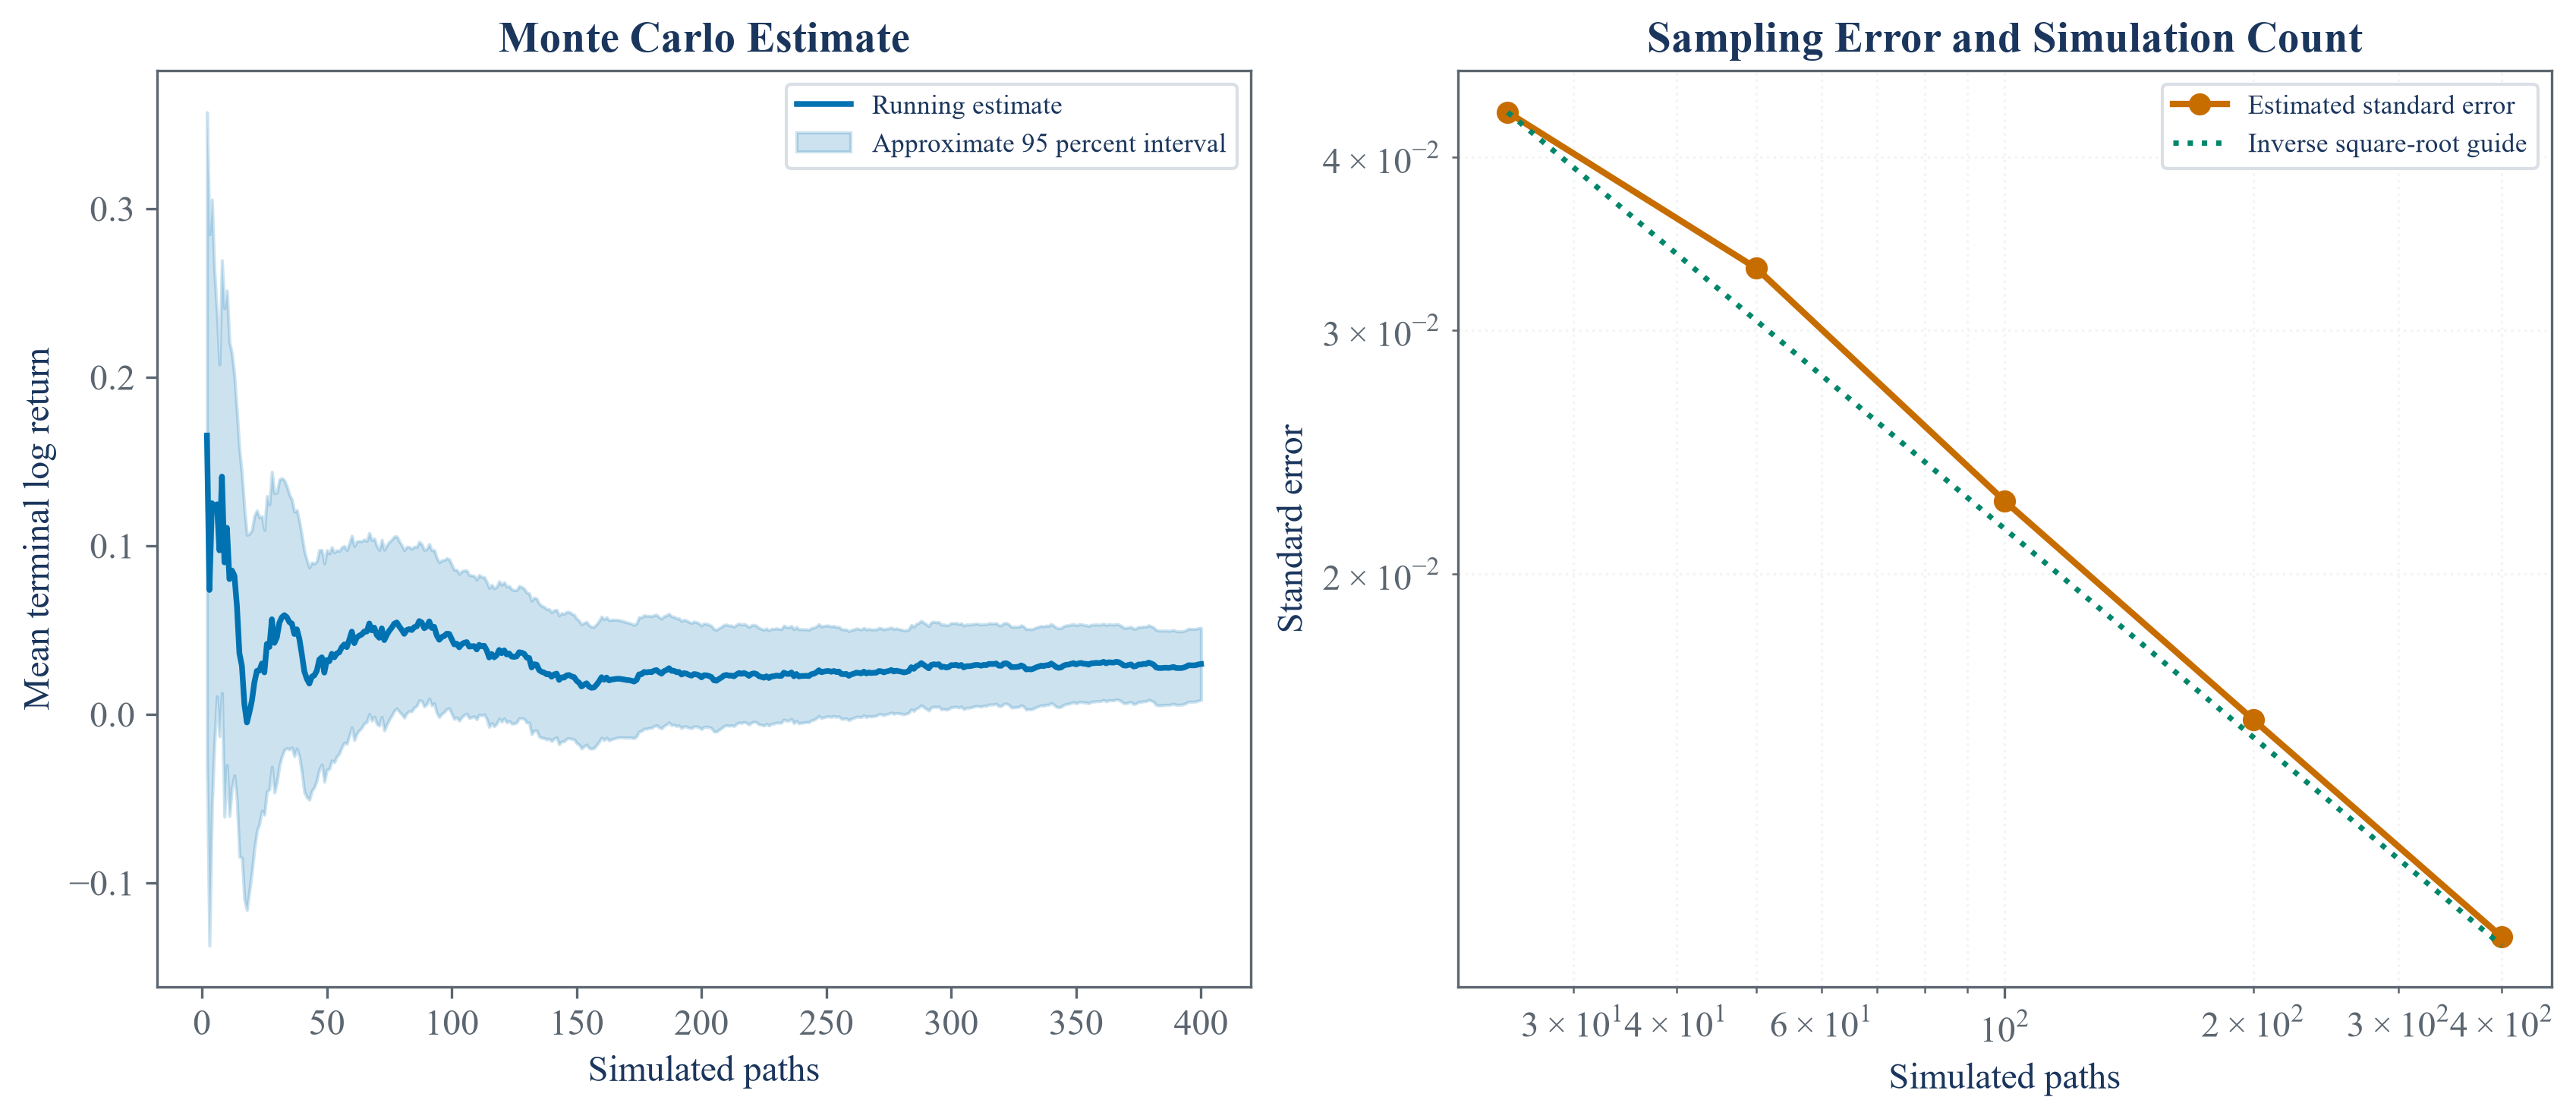
Repeated runs separate a stable average result from the variation caused by using a finite number of generated samples.
A generated experiment can verify calculations against a known truth. It does not show that the same data model describes a particular market.
Notebooks
| 1. Generating correlated returns |
| 2. Testing drift bursts against controlled null models |
| 3. Designing reproducible Monte Carlo experiments |